


1
2
3
4
5
6
7
8
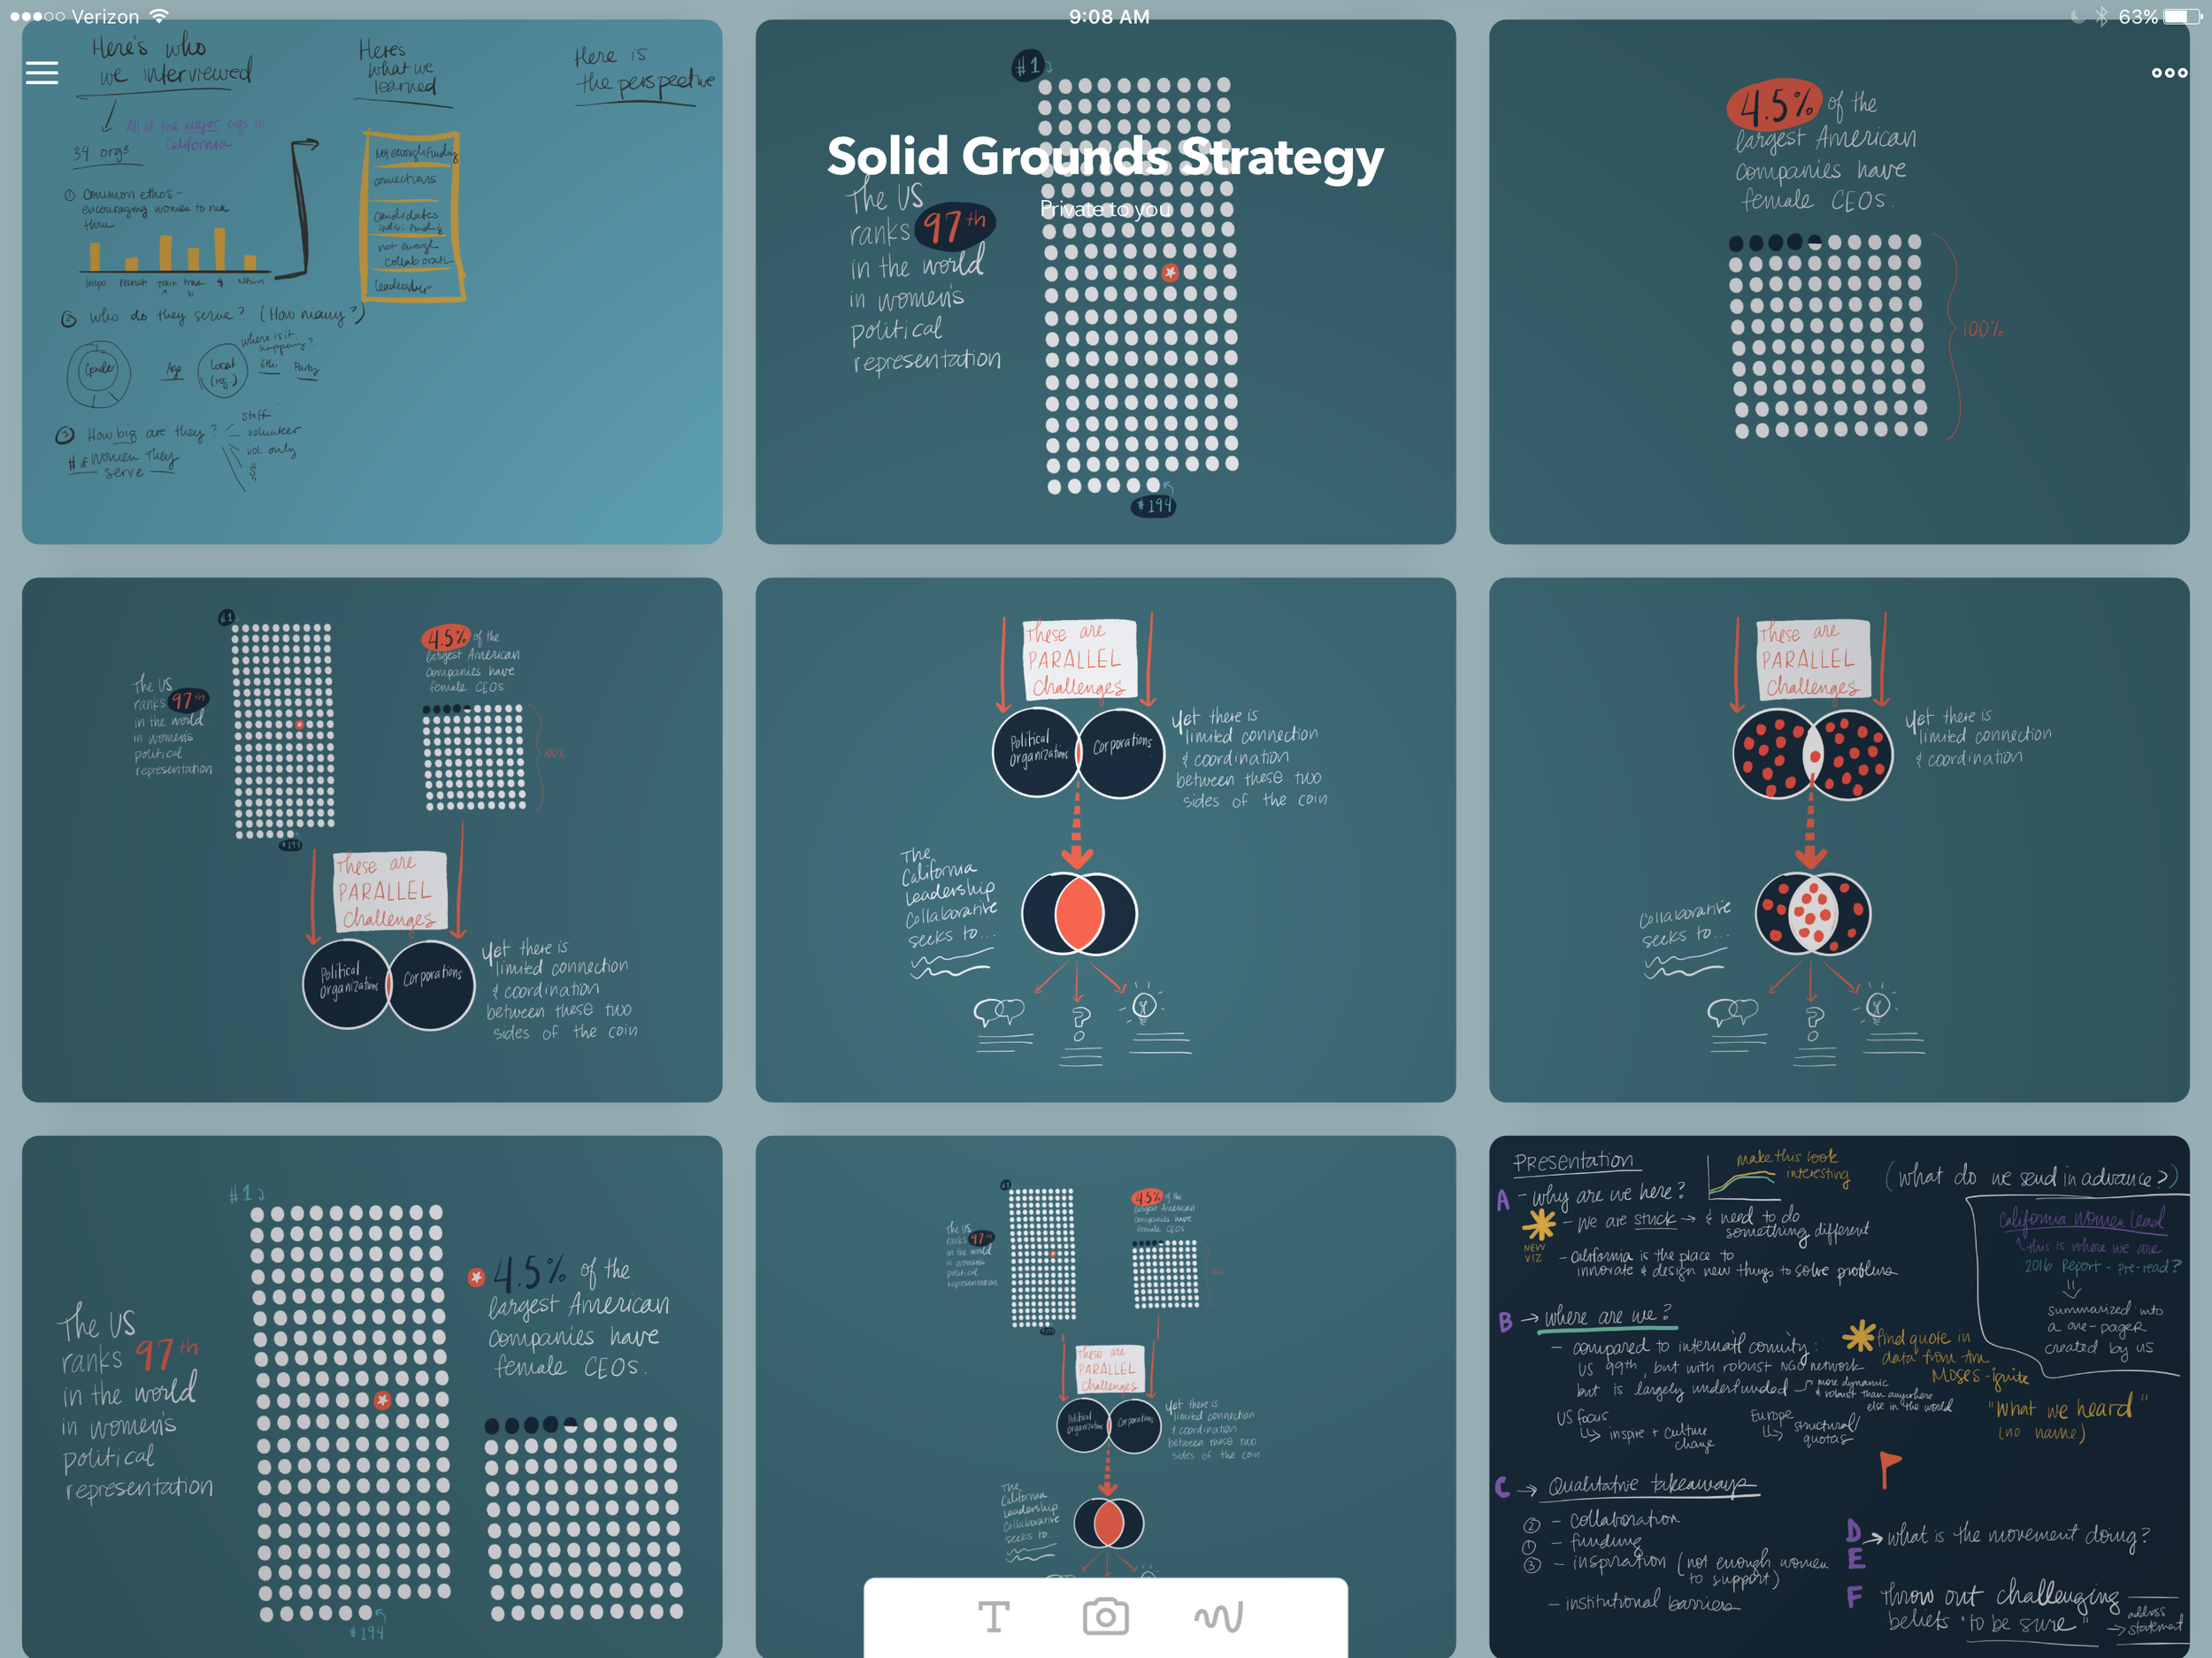
Visual Strategy Document. Thumbnails from a visual strategy document, provided after initial workshop.
Design Decisions. Early documentation providing options for the visualization style and approach.
Story Sketches. Concept Sketches for an initial project "teaser" infographic.
Information Design. A collection of data-heavy charts included in a presentation to Collaborative members.
Presentation Storyboarding. Physically mapping out the presentation storyboard with our visualizations with clients.
Presentation Slides. The results of the presentation storyboarding session.
Research Dashboard. A simple Tableau dashboard that visualizes some of the initial research on political orgs in California.
Microsite. With a quick visual strategy session we mapped out the new website and built in Squarespace the next day.