
Visualising Inequality (by hand!)
Client: MEI (2021)
Collaborators: Cat Van Saarlos
• data doodling • instructional design • facilitation •

In 2021 I collaborated with Cat Van Saarlos, a support and development coordinator for Mathematics, Education, Innovation (MEI), who approached me with a brilliant idea for a workshop and contest centered around hand drawn data visualization. The aim was to help students and teachers across the UK understand, communicate, and creatively explore statistics as part of the programming for Maths Week England, which took place Nov 8–12, 2021.
All of the resources for this program are available through the MEI / AMSP organization website.
A brief preamble…
The math ain’t mathing…
As a young student, I hated math. I struggled with memorization, I found myself lost in the steps of different formulas, and suffered from serious performance anxiety. (Actually, I STILL do! Simple addition and subtraction is impossible for my brain to complete if there is any kind of time constraint or audience). In college, I struggled my way through advanced calculus and discrete math in order to obtain a Computer Science minor to compliment my Studio Art degree, but these courses still haunt my dreams on a regular basis.
Graphic Design seemed to be a perfect fit for me— it required creativity, problem solving, spatial reasoning, and very little math. My first few jobs required a lot of print and layout design (posters, books, brochures, etc) and as I was given more leeway and creative freedom, I found myself diving deep into the subject matter the products sought to communicate. I didn’t like being told how things should look. Instead, I preferred working with clients who asked, “what would be the best way to explain this?”. Inevitably, this required creating graphs, maps, diagrams, and other quantitative forms. And, I think that my aversion to numbers made me the perfect person for this type of work.
…but numbers make sense!
The way I understand anything complex is to draw it out, sometimes over and over again from different view points. Once the concept clicks for me, I do the work of integrating the audience and their perspectives to come up with a design that will resonate. The first data sets I worked with were presented in simple bars, pies, and line graphs, and I found a deep satisfaction in experimenting with different visual treatments and chart types until the stories in the data became clear and obvious. And this is how my unexpected journey back into math and numbers began.
Still a junior designer, the phrase “big data” started increasingly buzzing. Visualization programs like Tableau hit the market, making it SO MUCH EASIER to design graphs and maps. The handful of books on the subject (Edward Tufte, Nathan Yau, and Stephen Few were the go-to’s back then!) became my teachers. My interests intersected with an exploding field that my employer was super eager to capitalize on. A few years later I found myself as the lead designer for an analytics and data visualization studio in the world of management consulting.
As a child, I never would have guessed any job I had would involve showcasing the work of leading statisticians and data scientists. (Let alone be leading a workshop for maths teachers all over the United Kingdom!)
Designing the Program
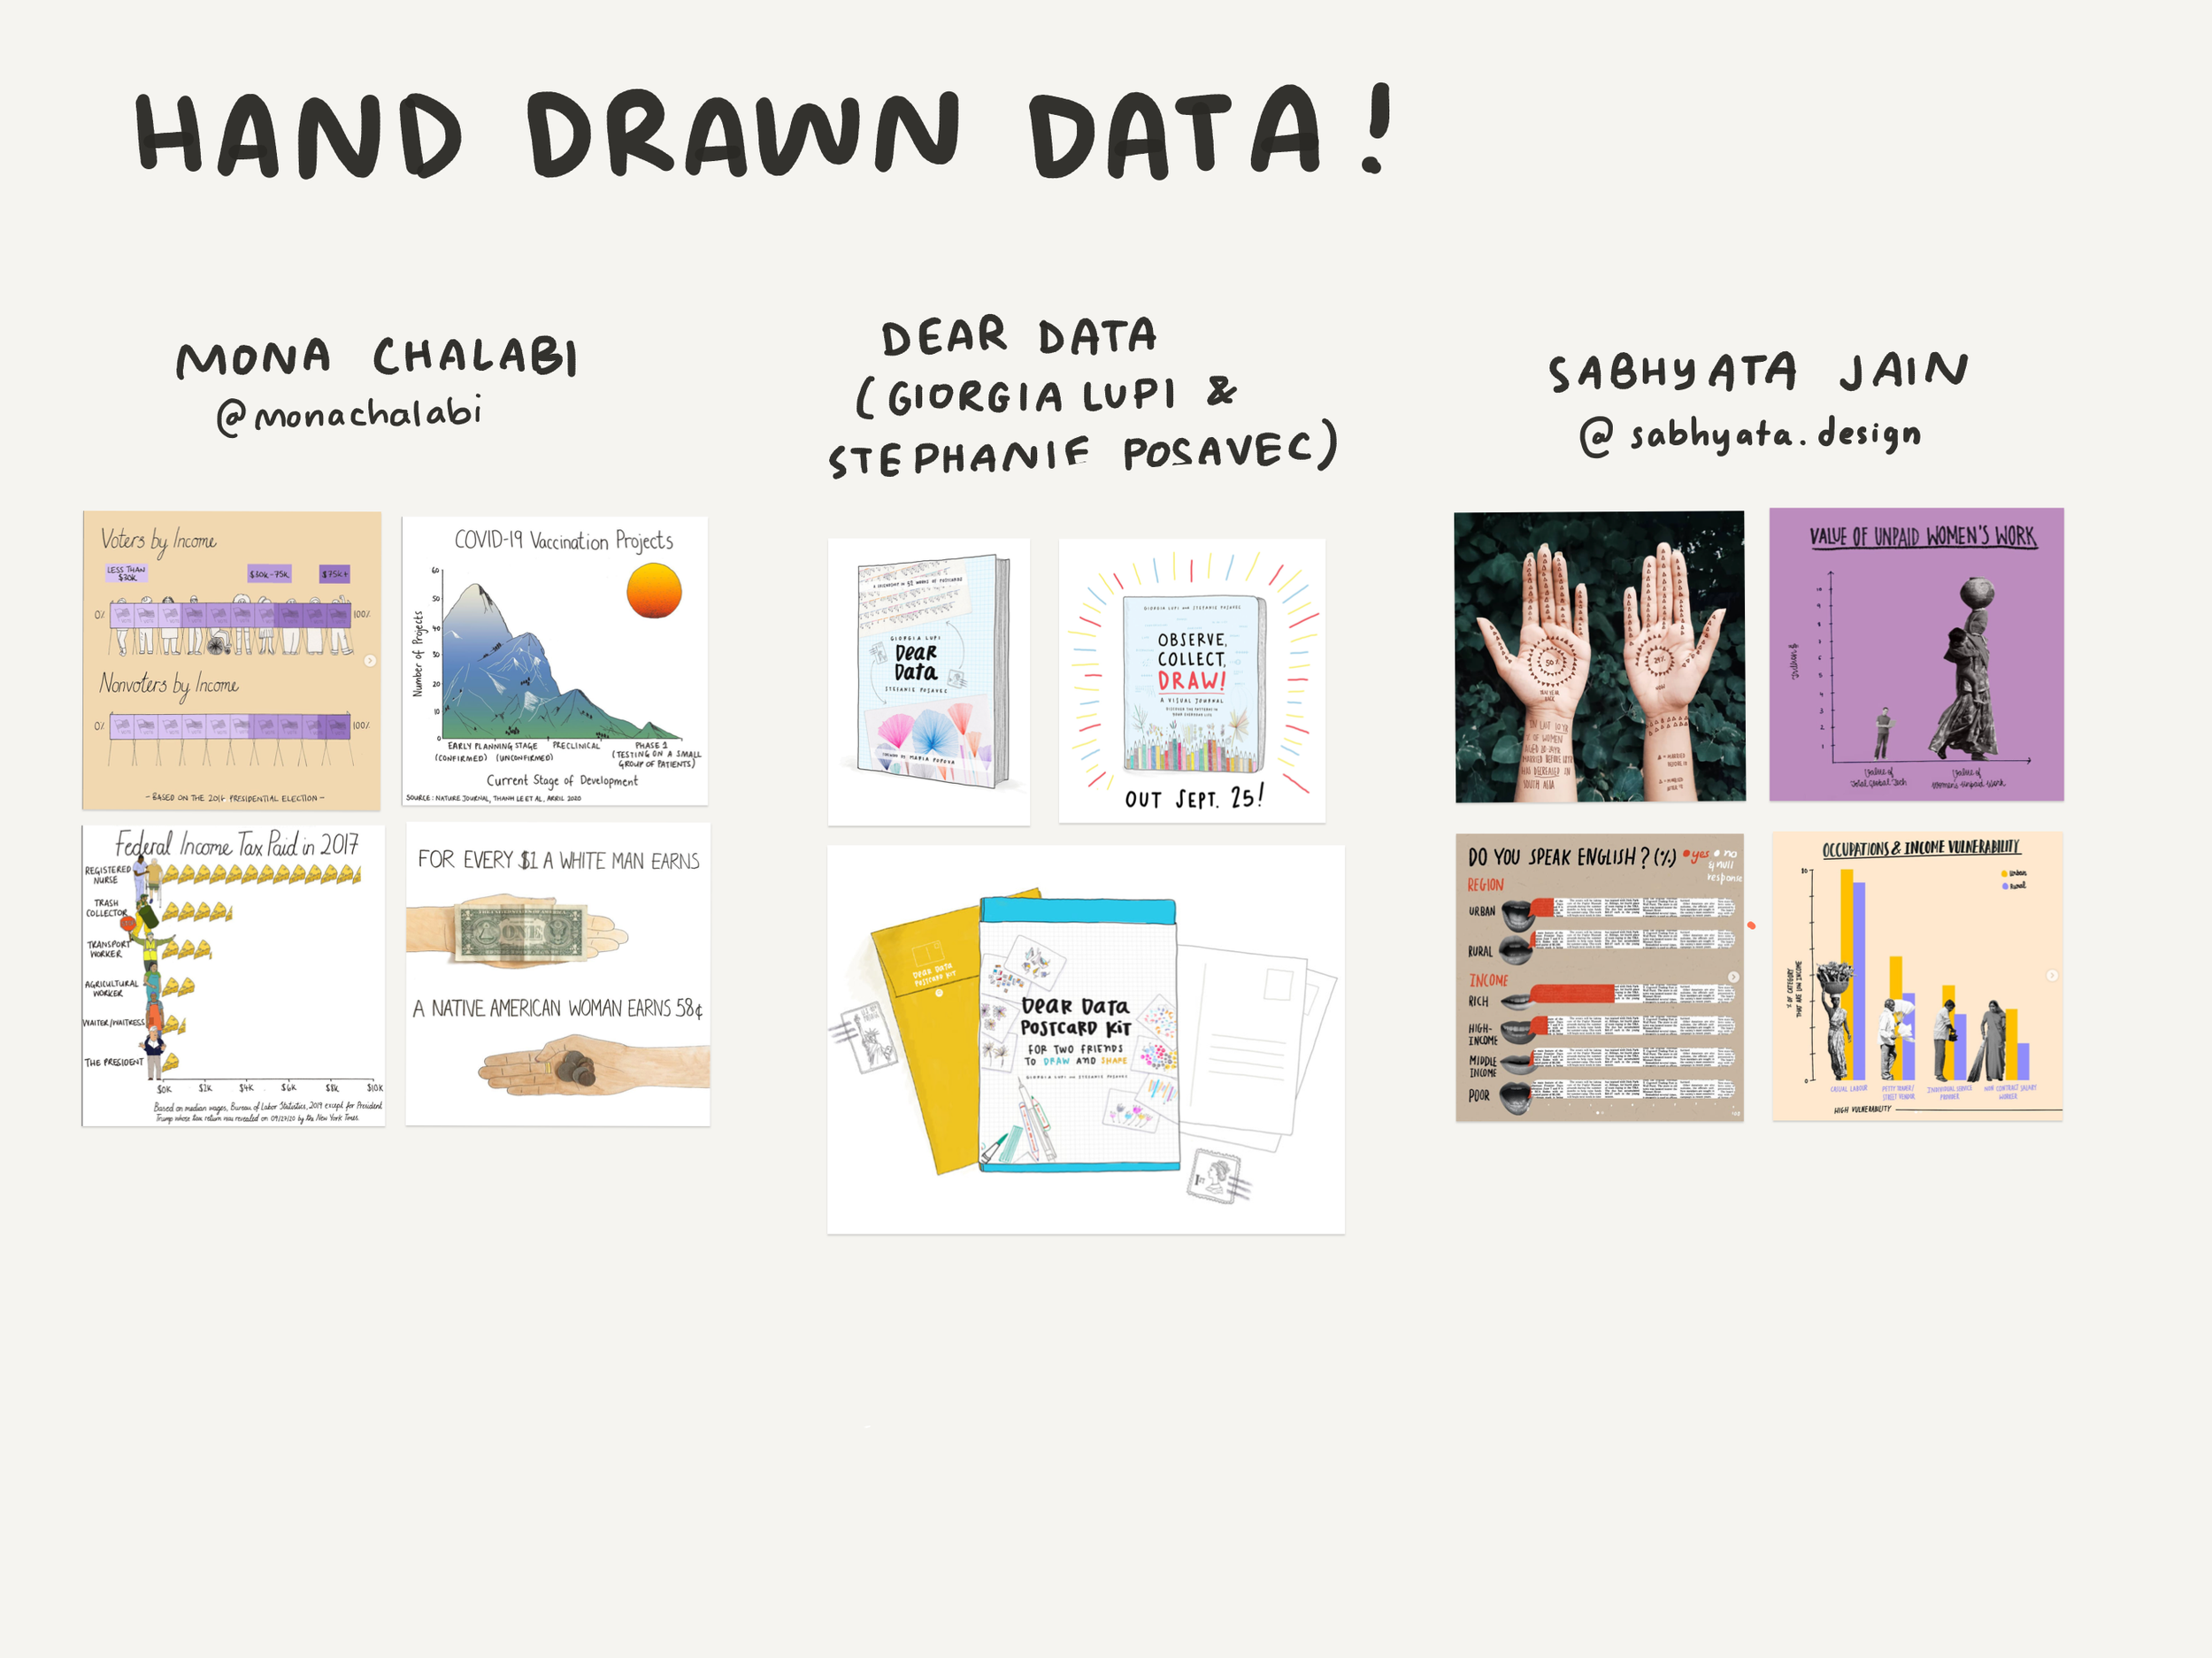
When Cat reached out to me in early 2021, she had a clear vision for this program. She felt inspired by the work of people like Mona Chalabi, Giorgia Liupi, and myself. She wanted to bring this type of creativity into Core Maths, and at the same time, help people understand an often misunderstood topic: income inequality. I was immediately sold on the idea, and we got to work putting together a curriculum that we could feel proud of.
Here’s the “design brief”:
2-hour webinar during the Core Maths Festival with 100-150 participants who are maths teachers across the UK
Goal: Run through a hand drawn data exercise with the teachers so that they can teach it to their students
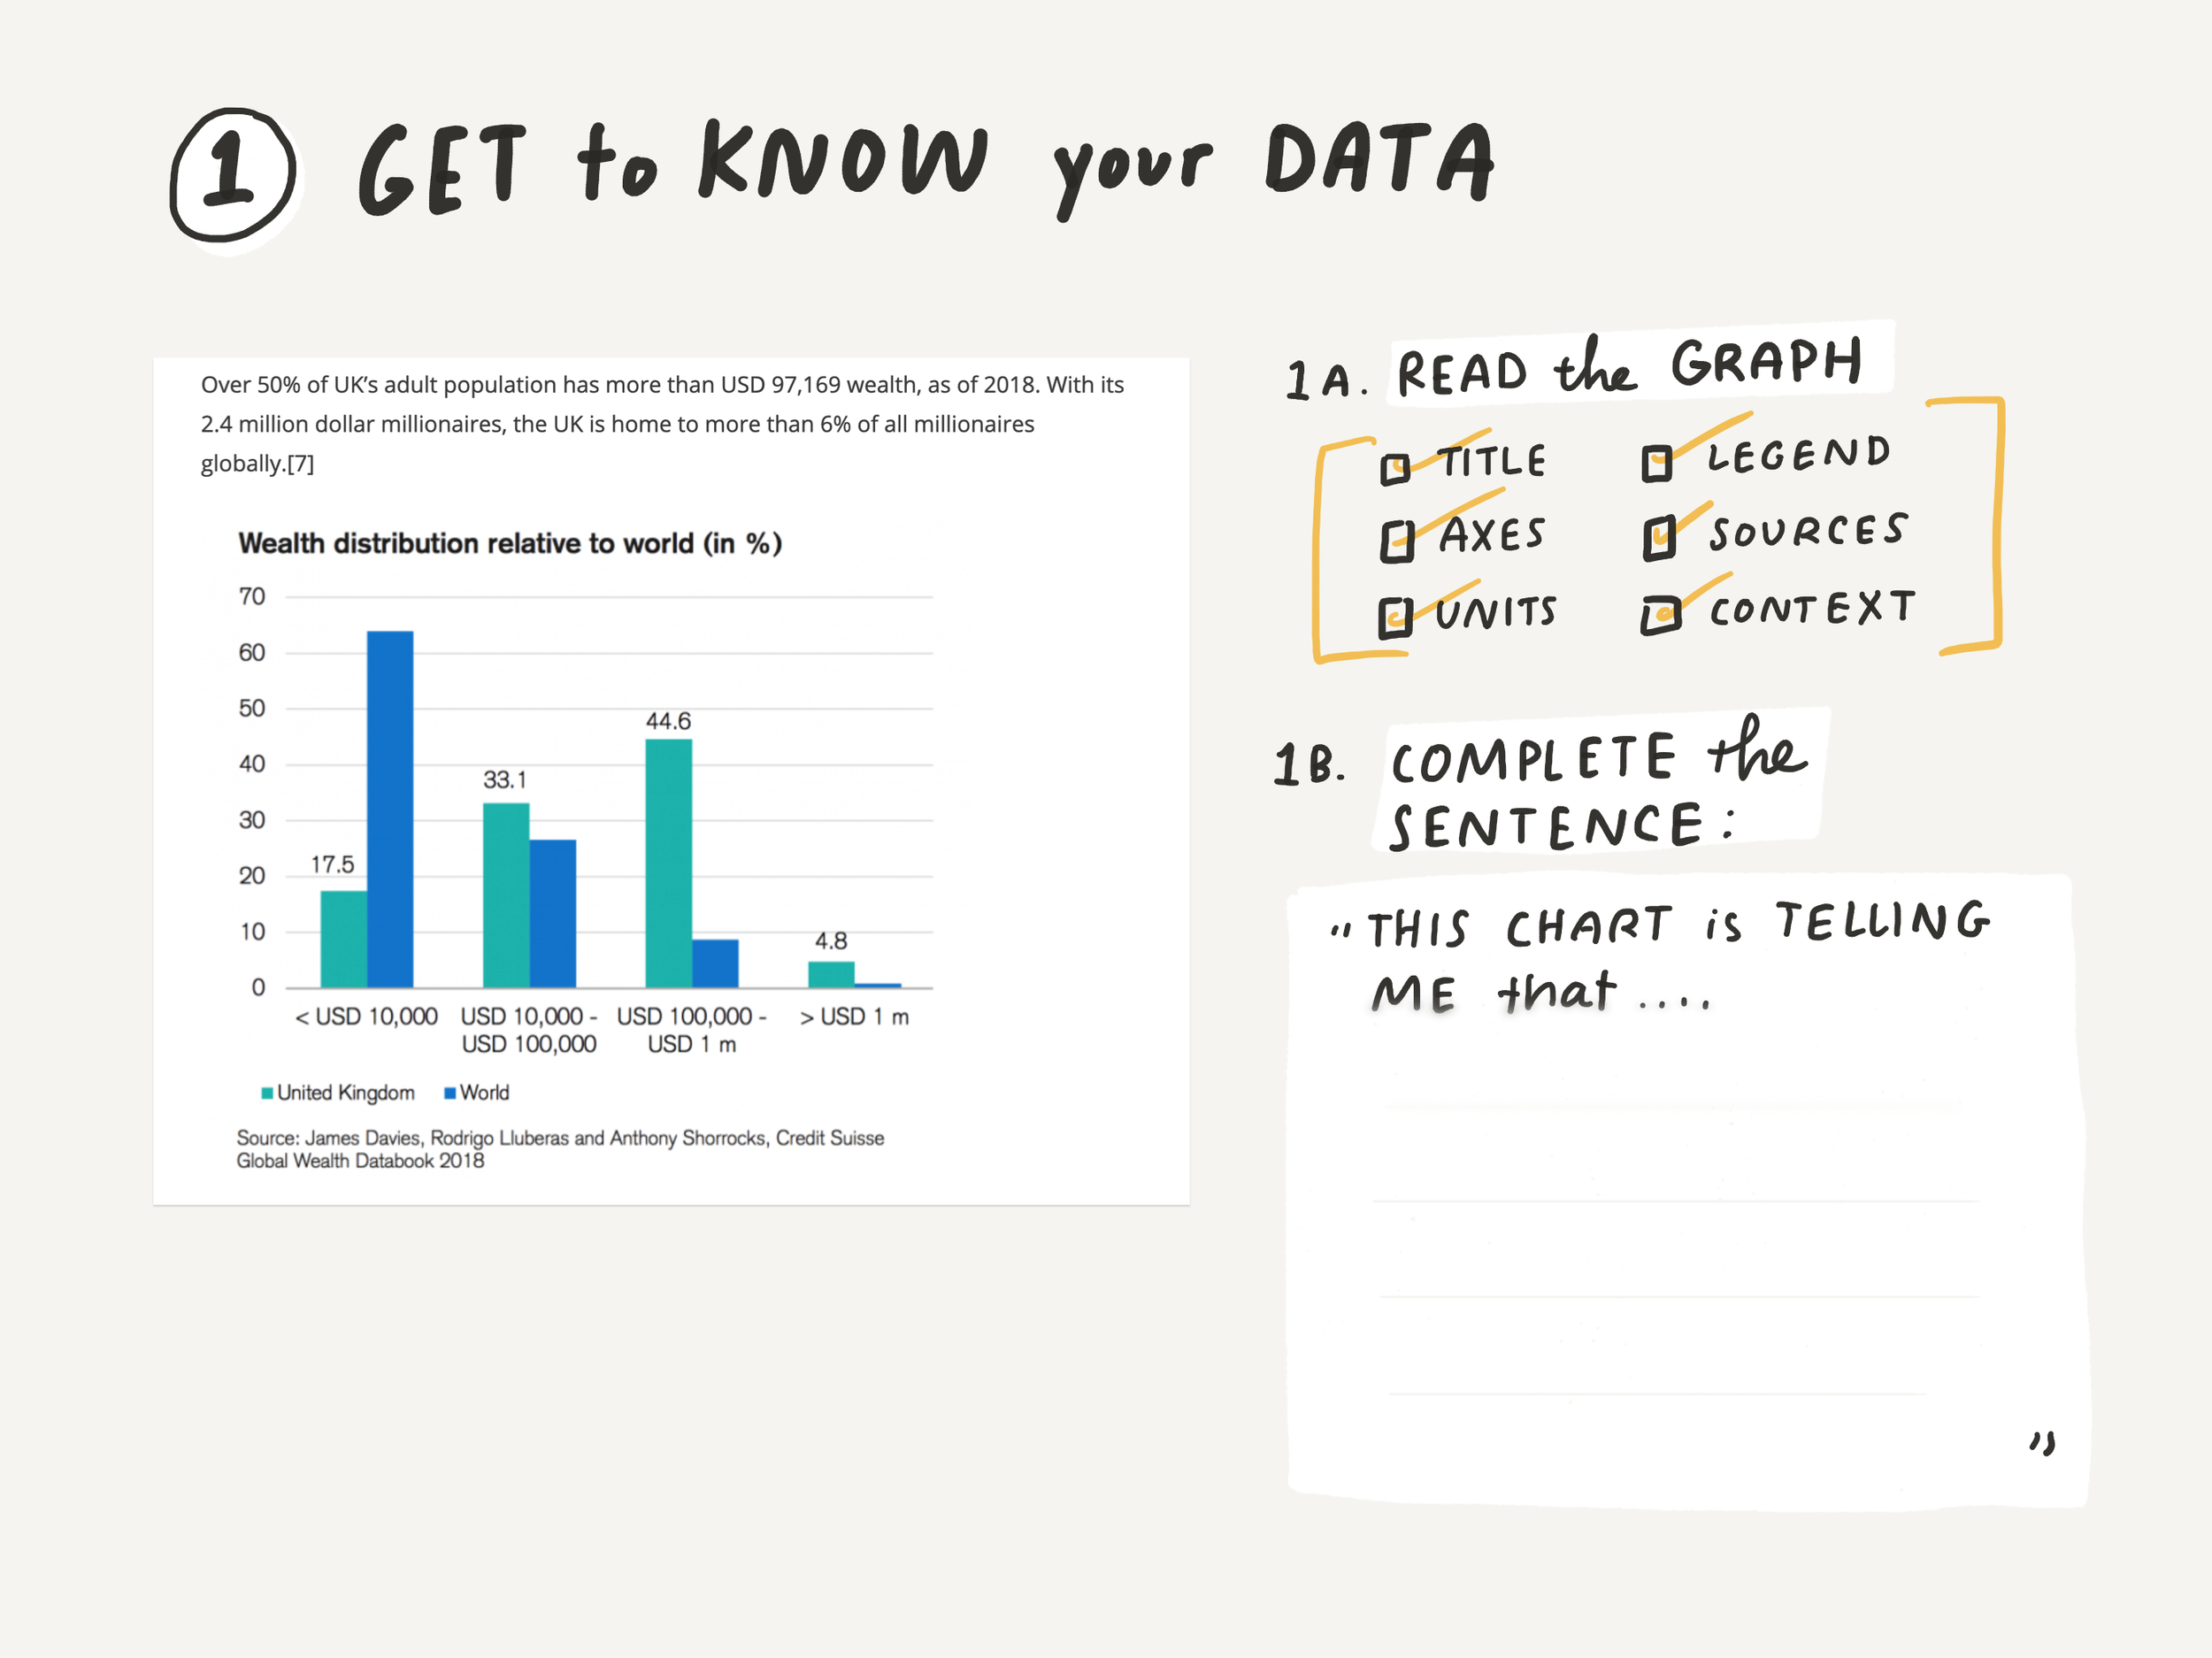
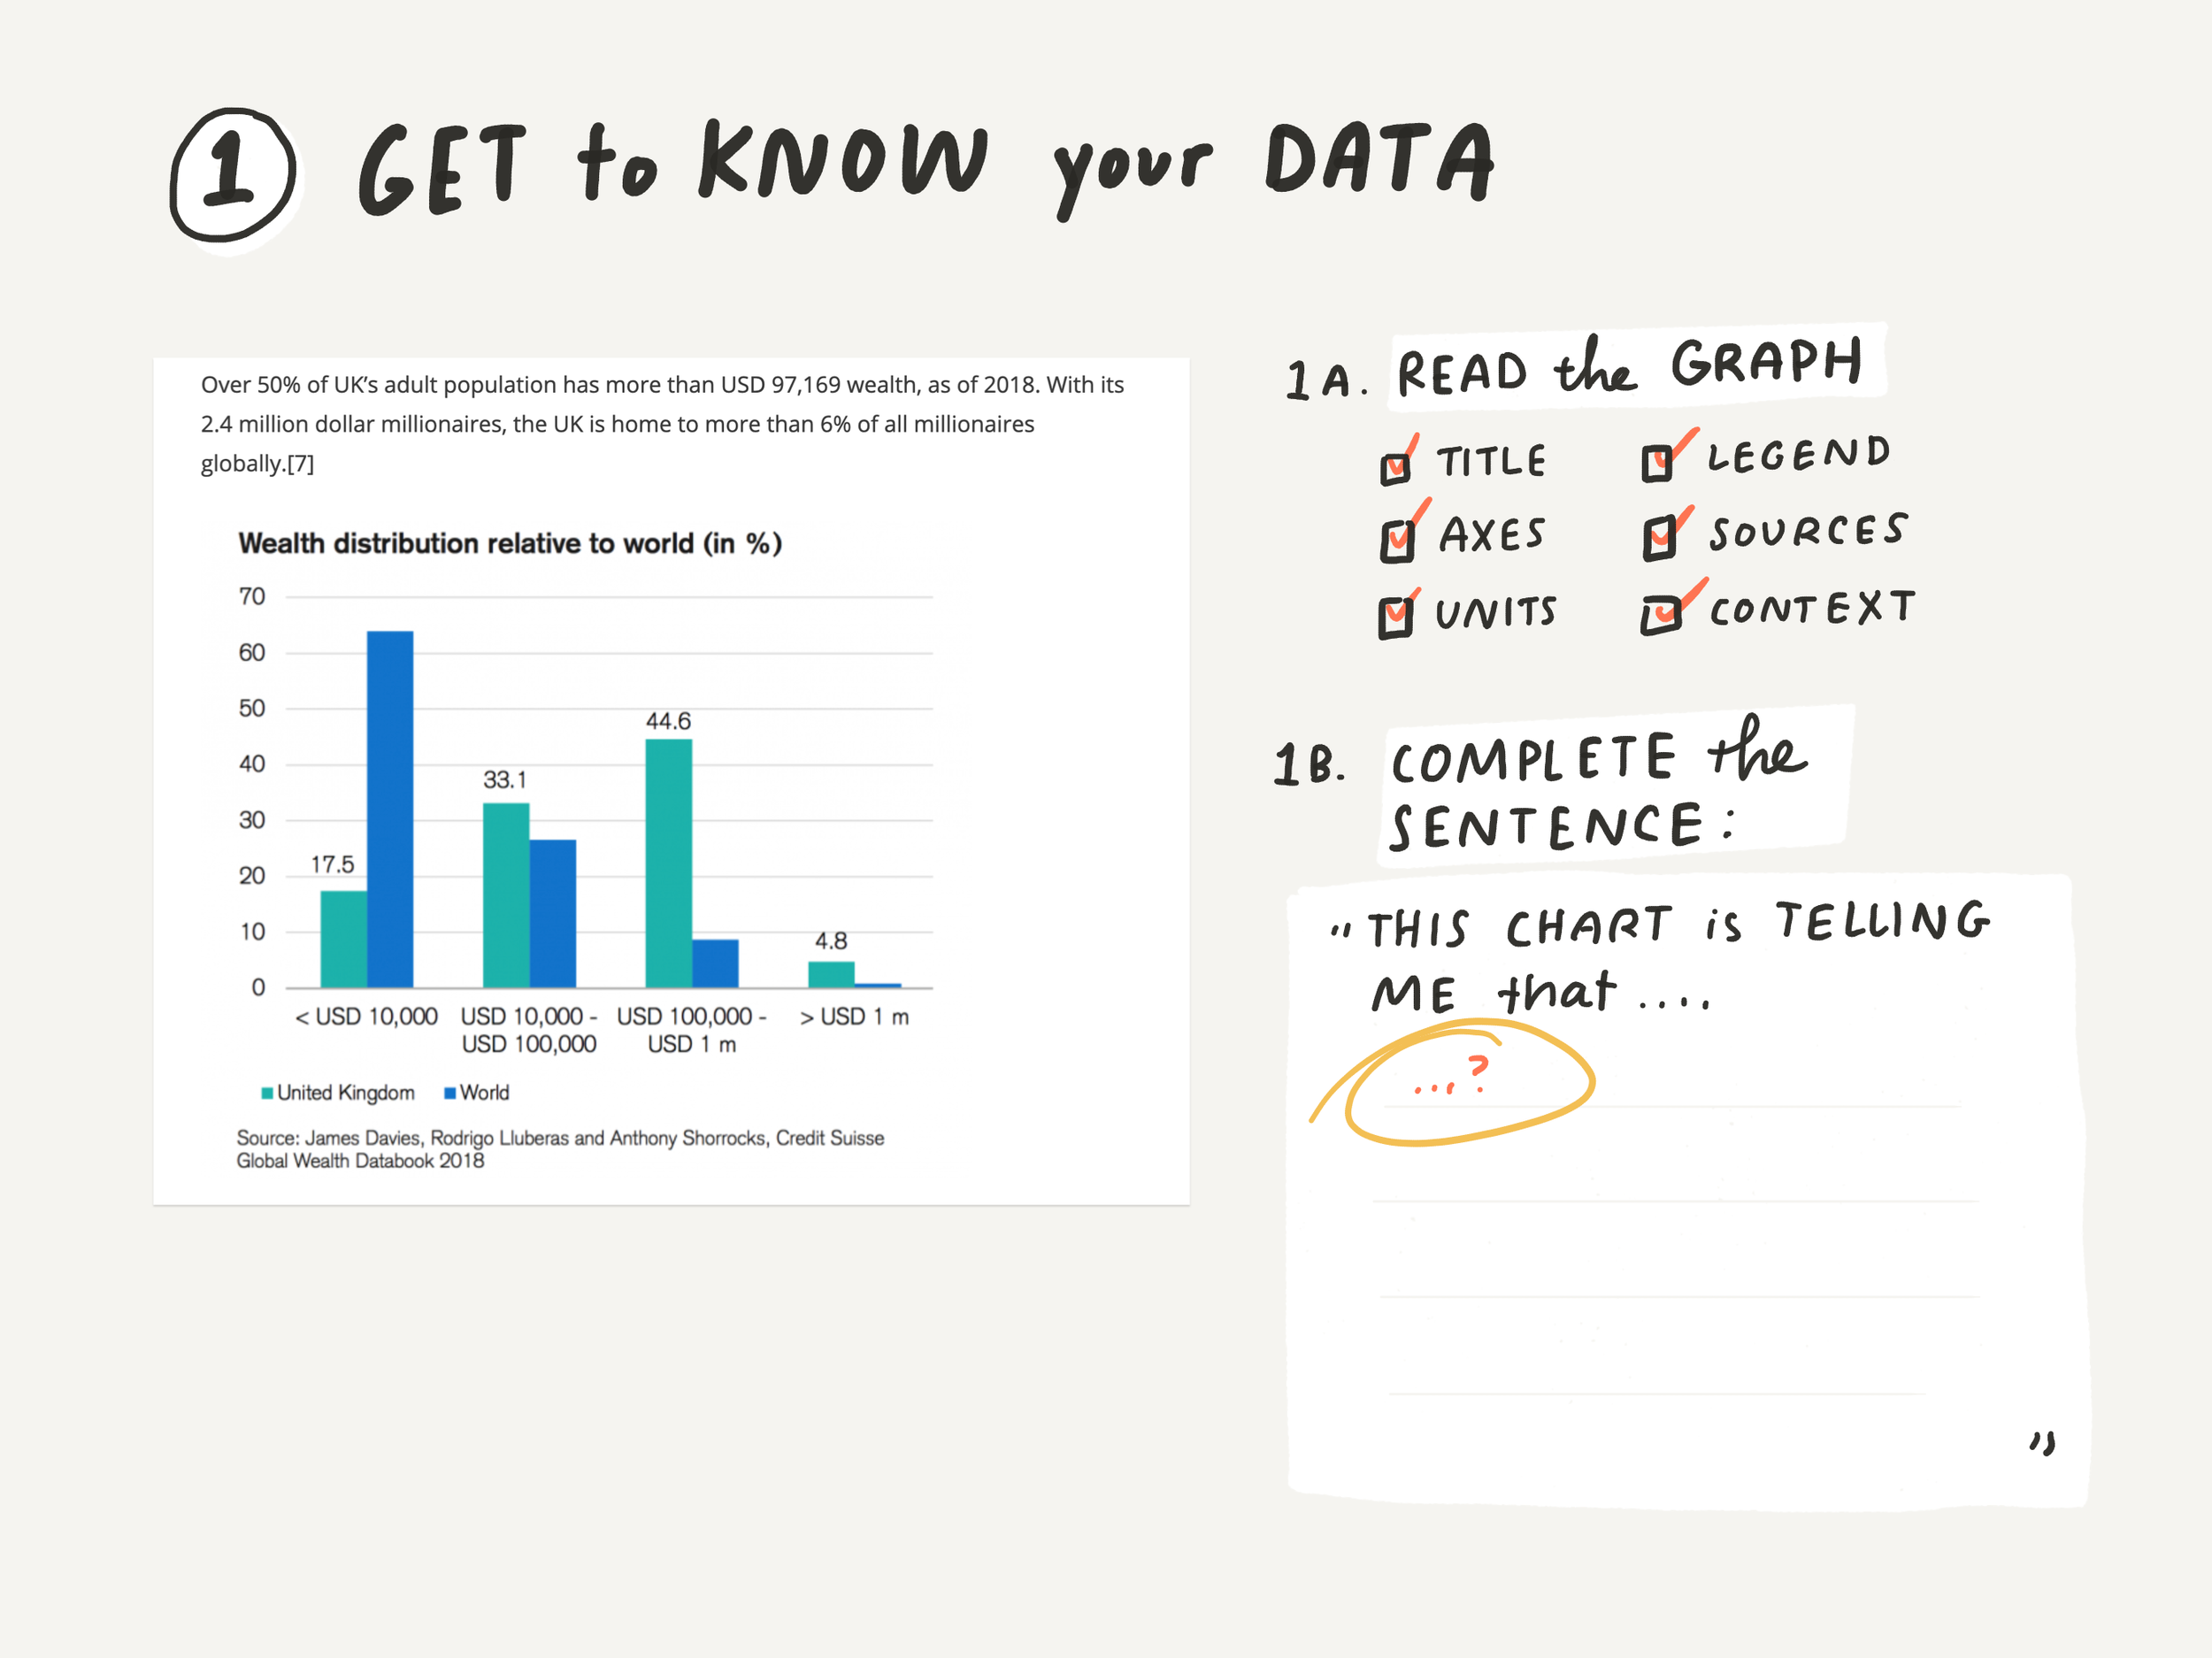
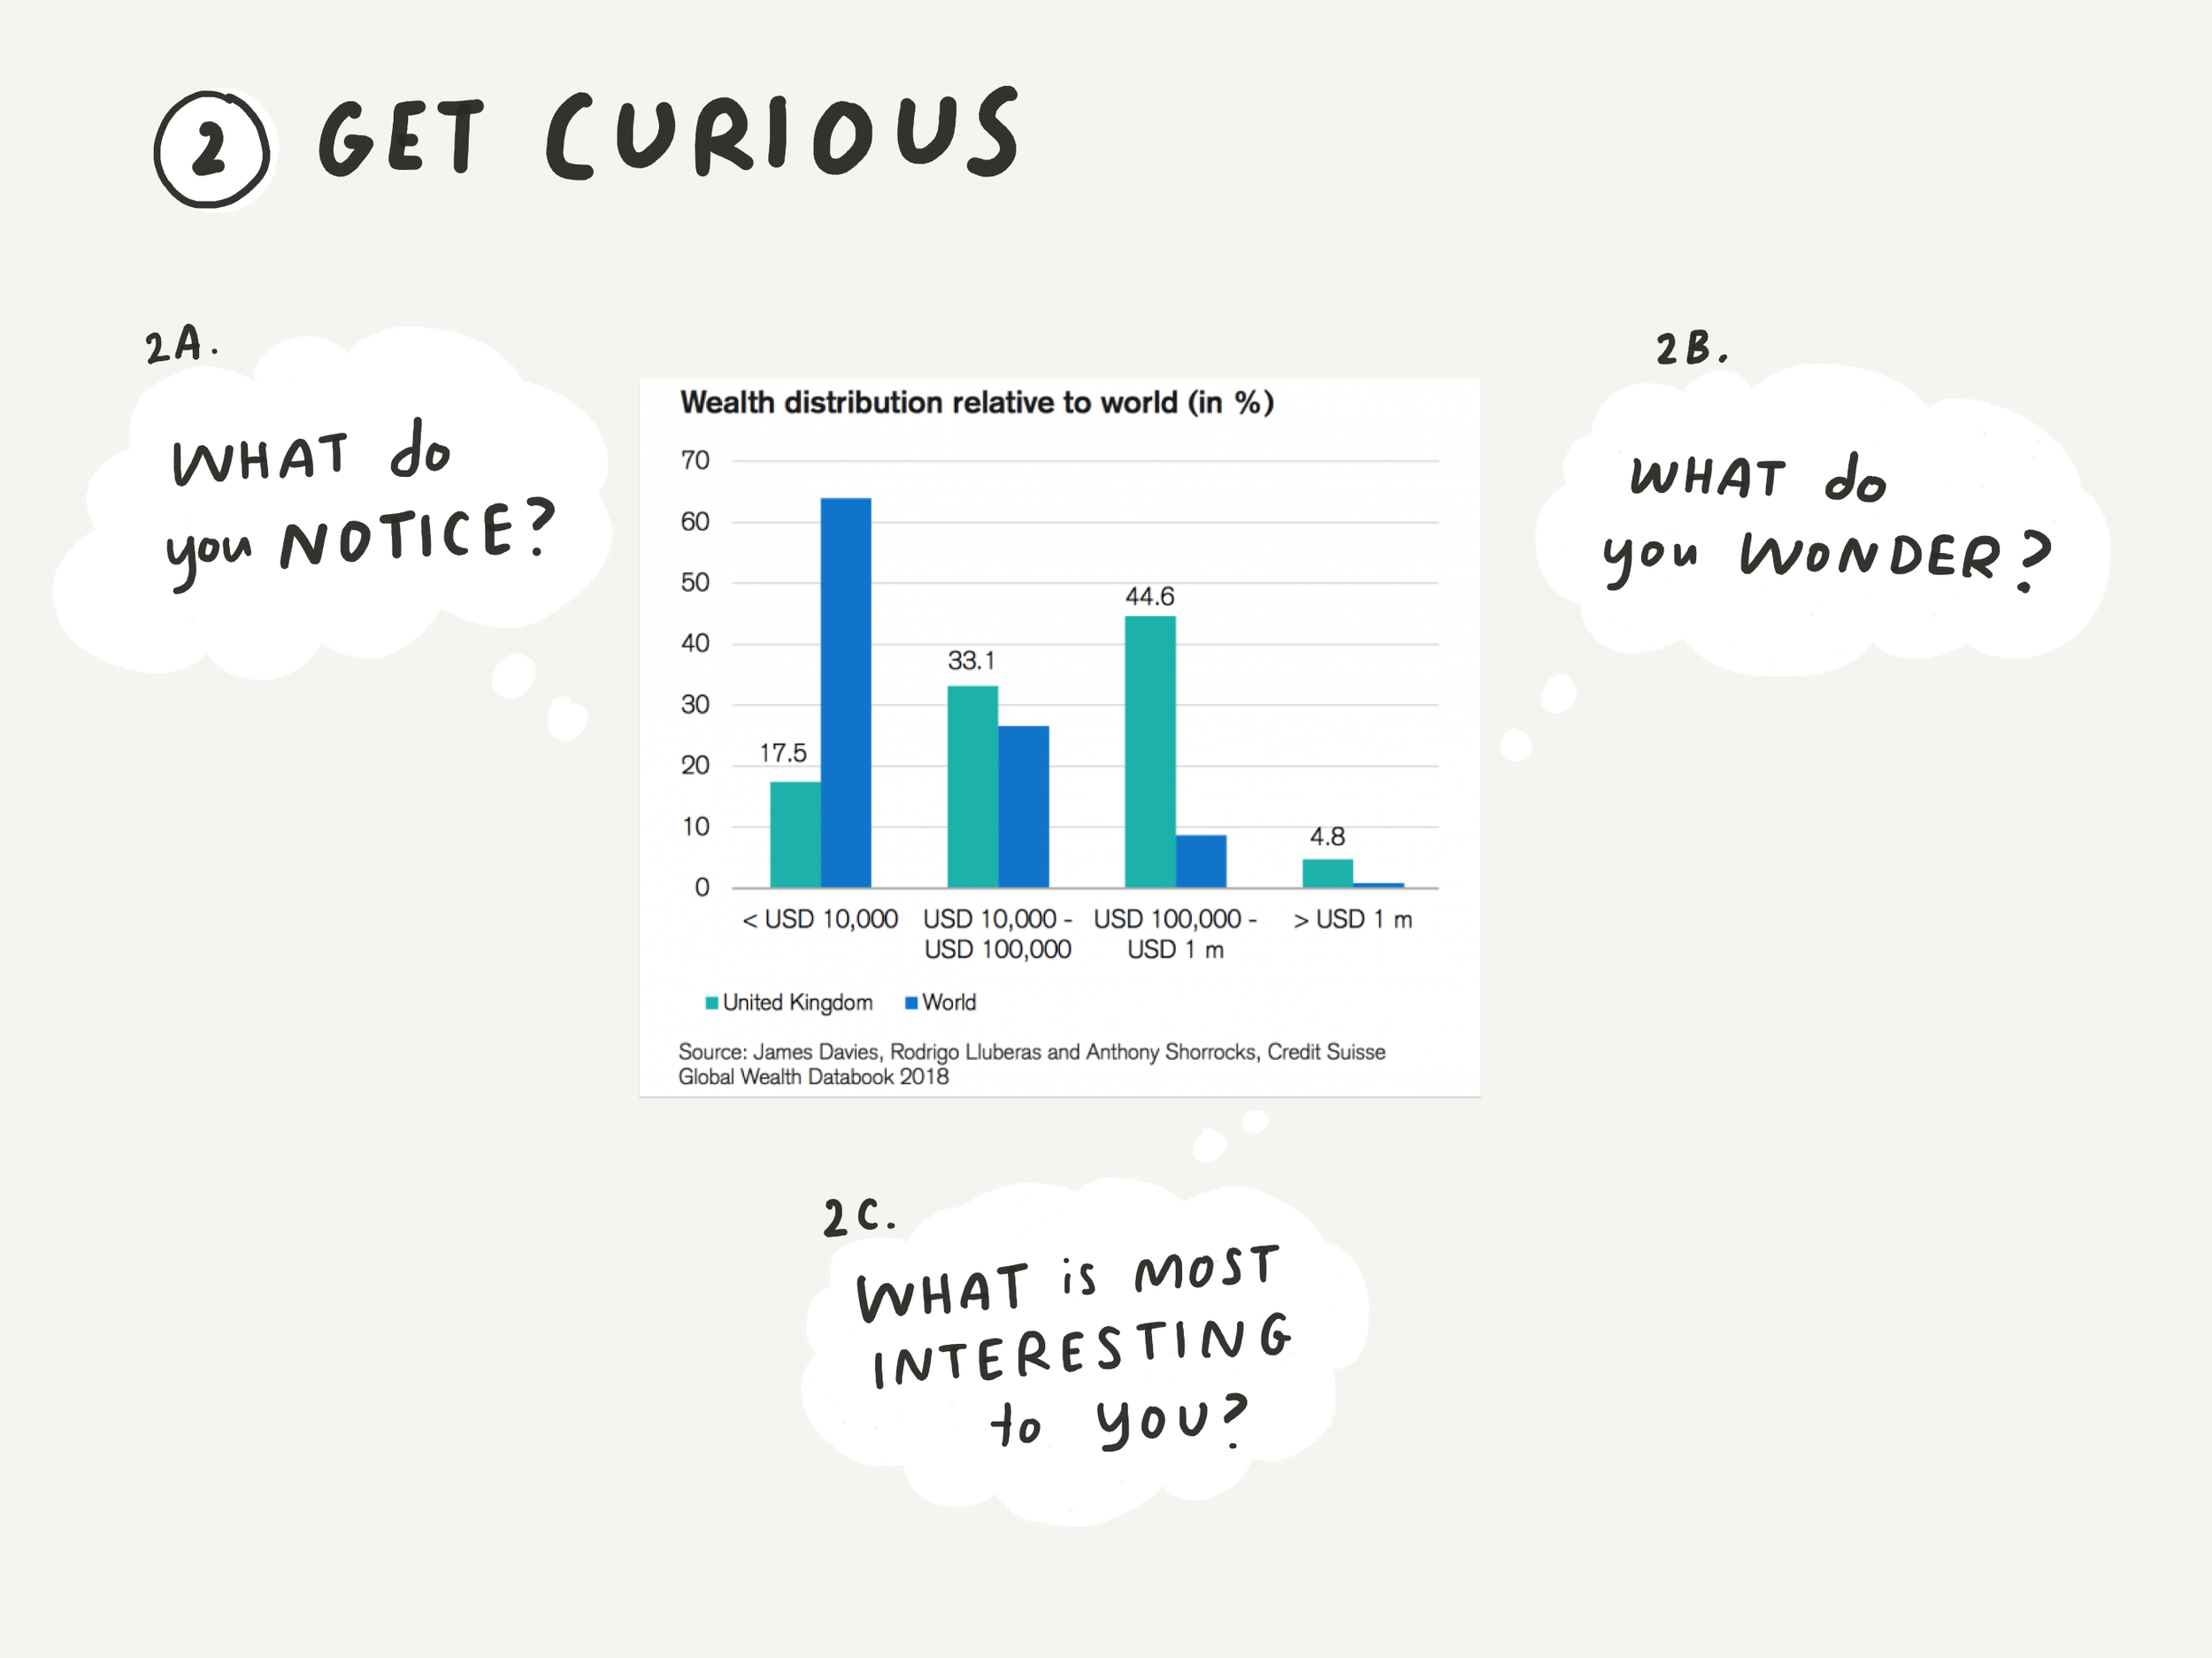
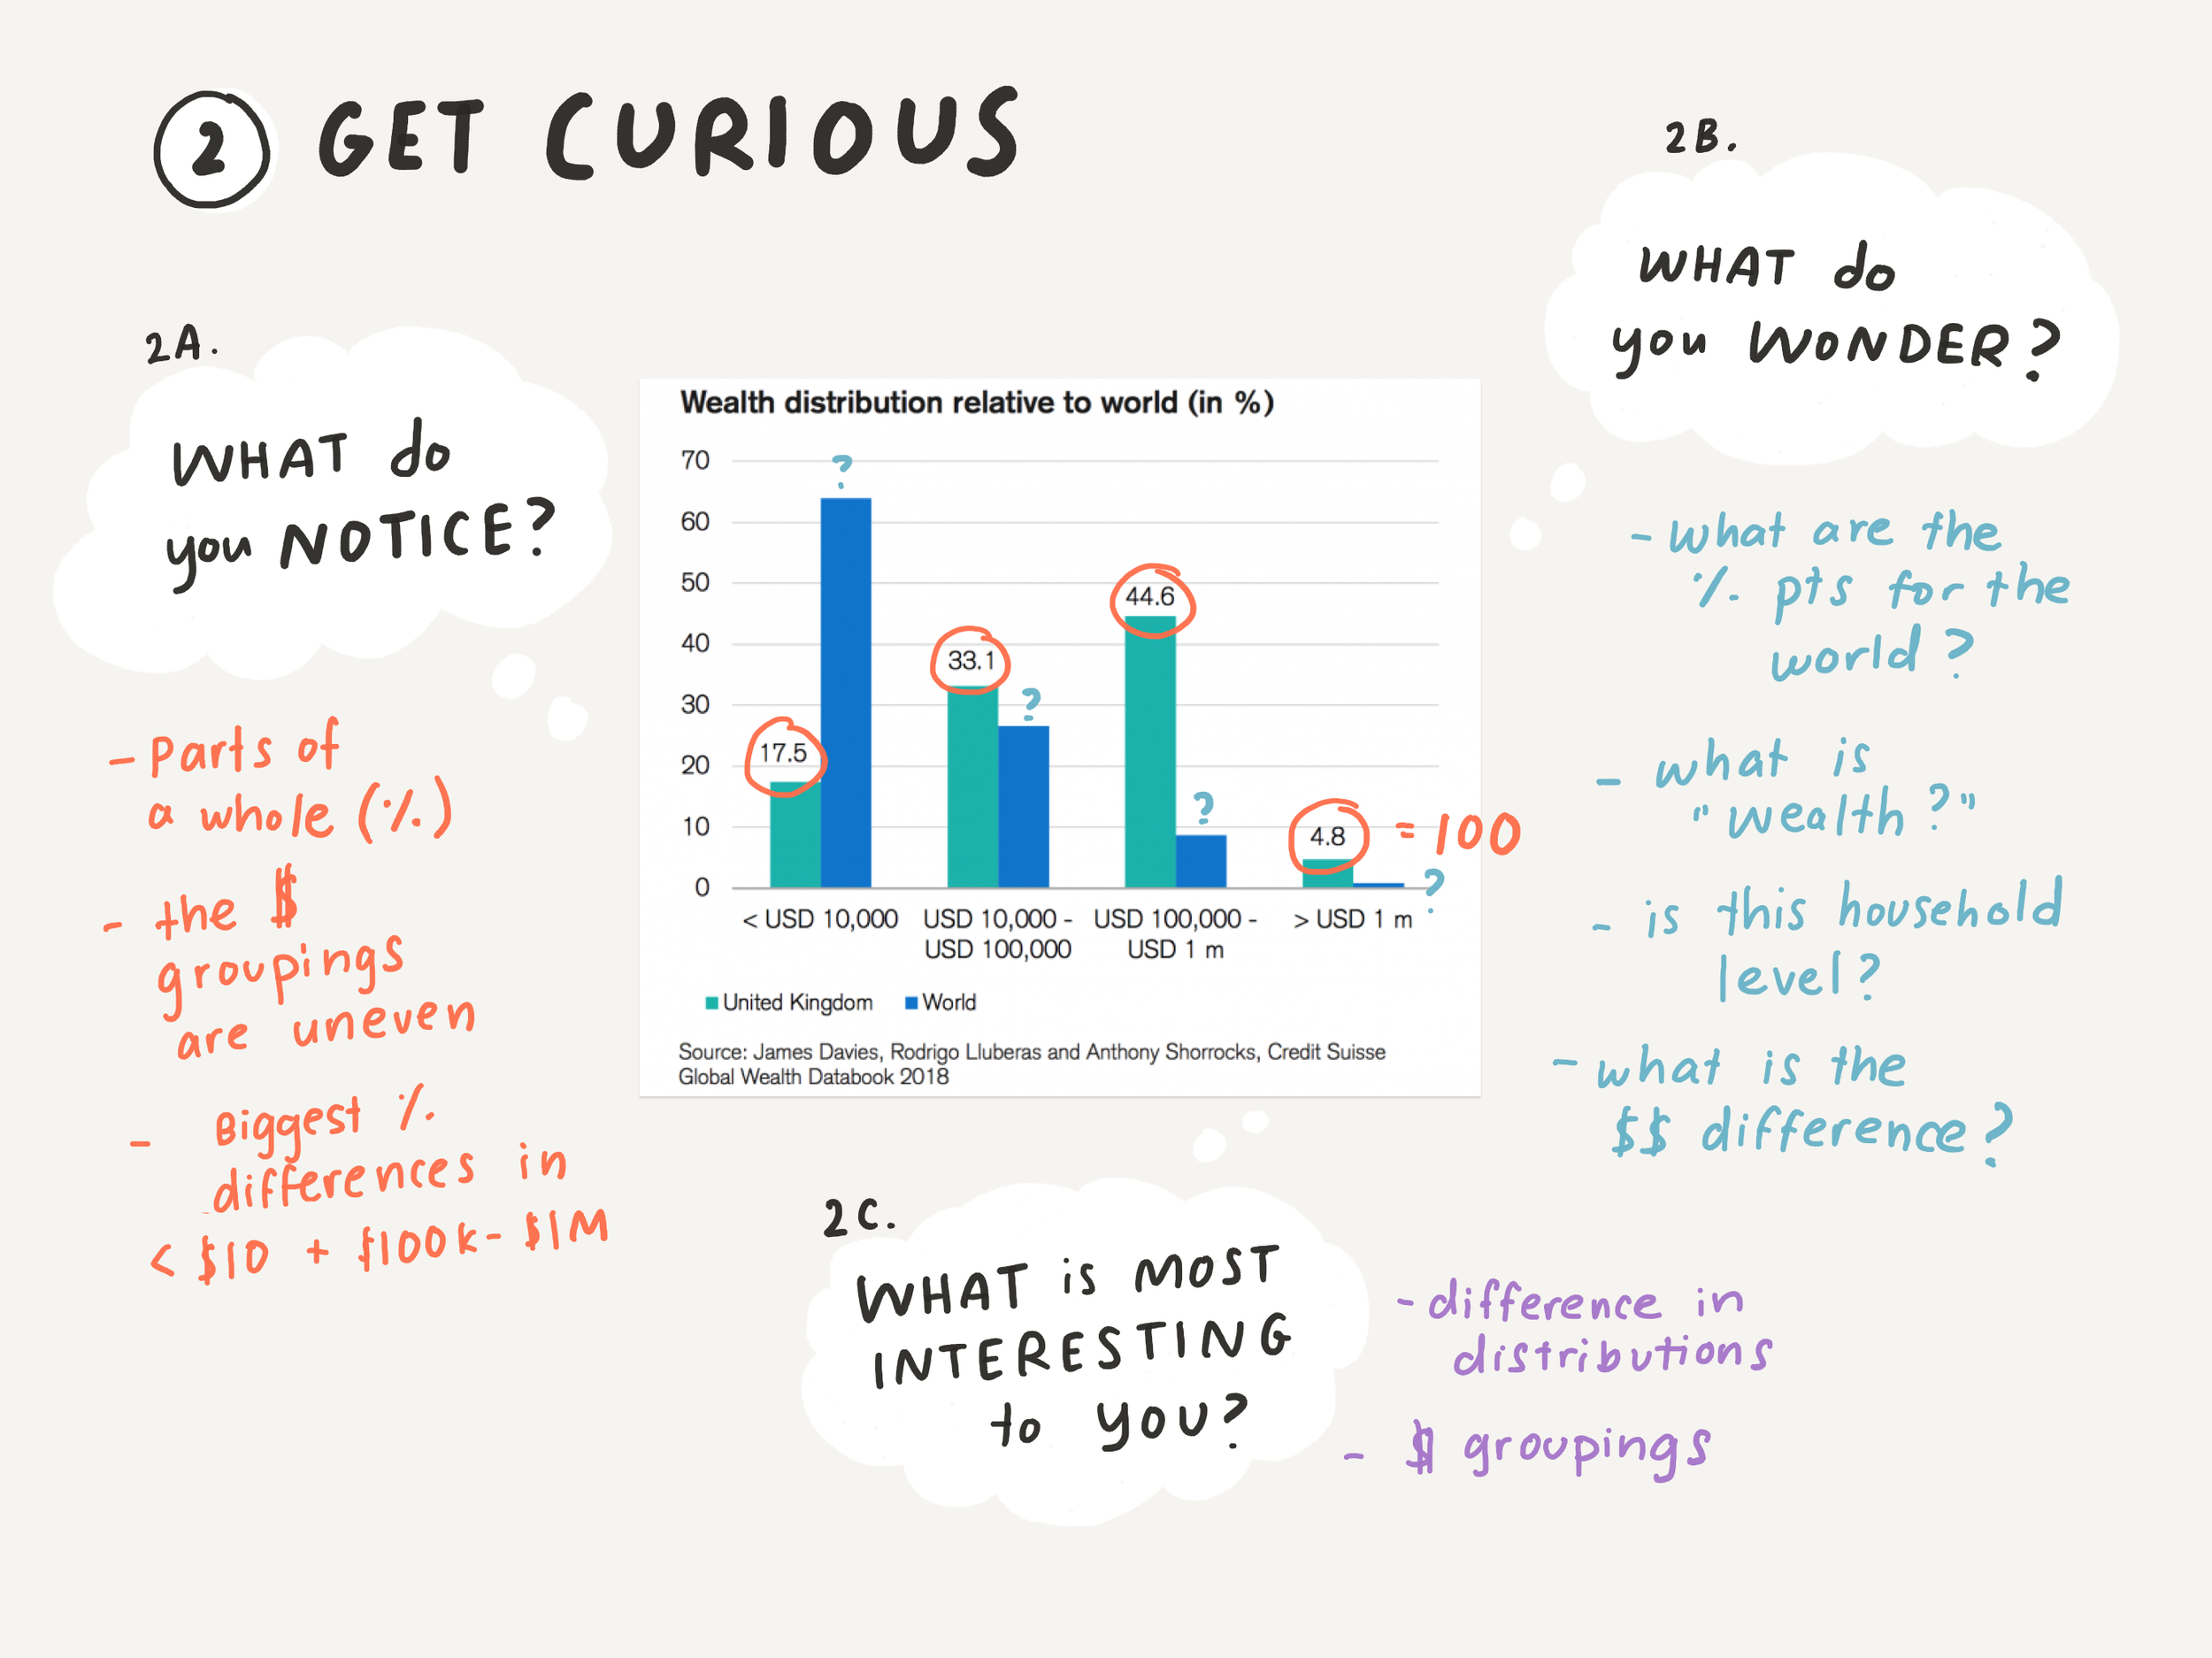
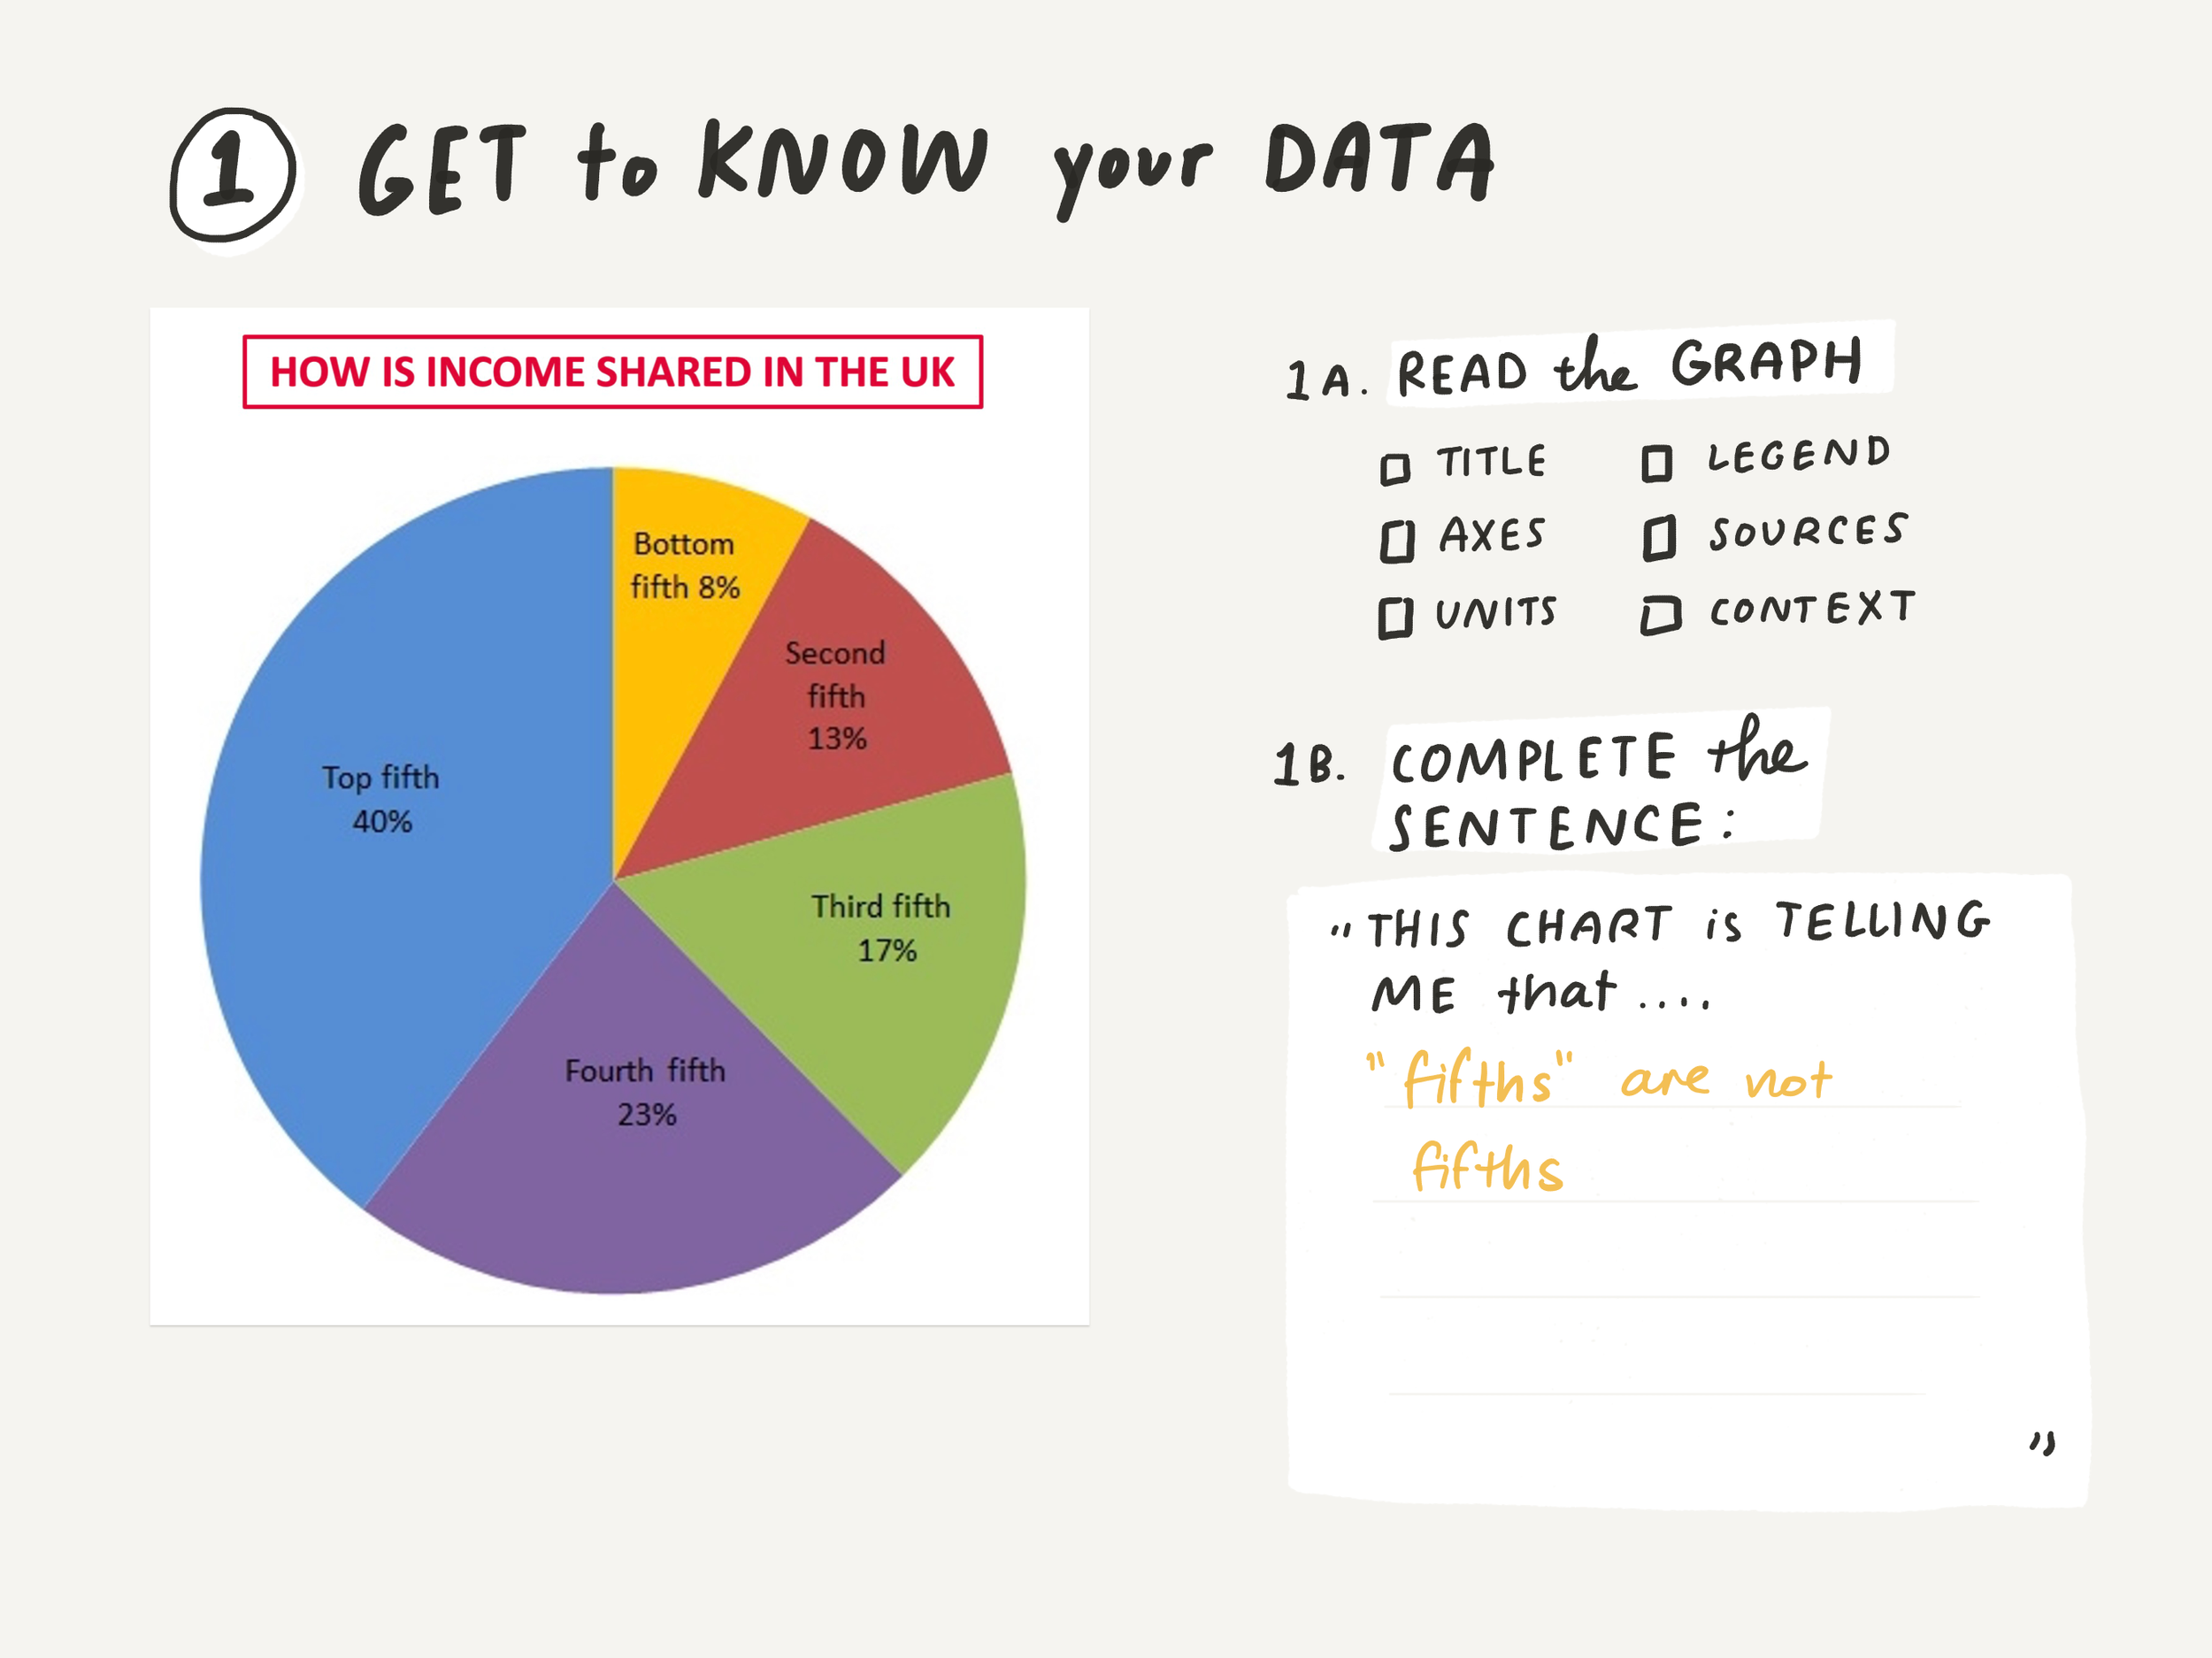
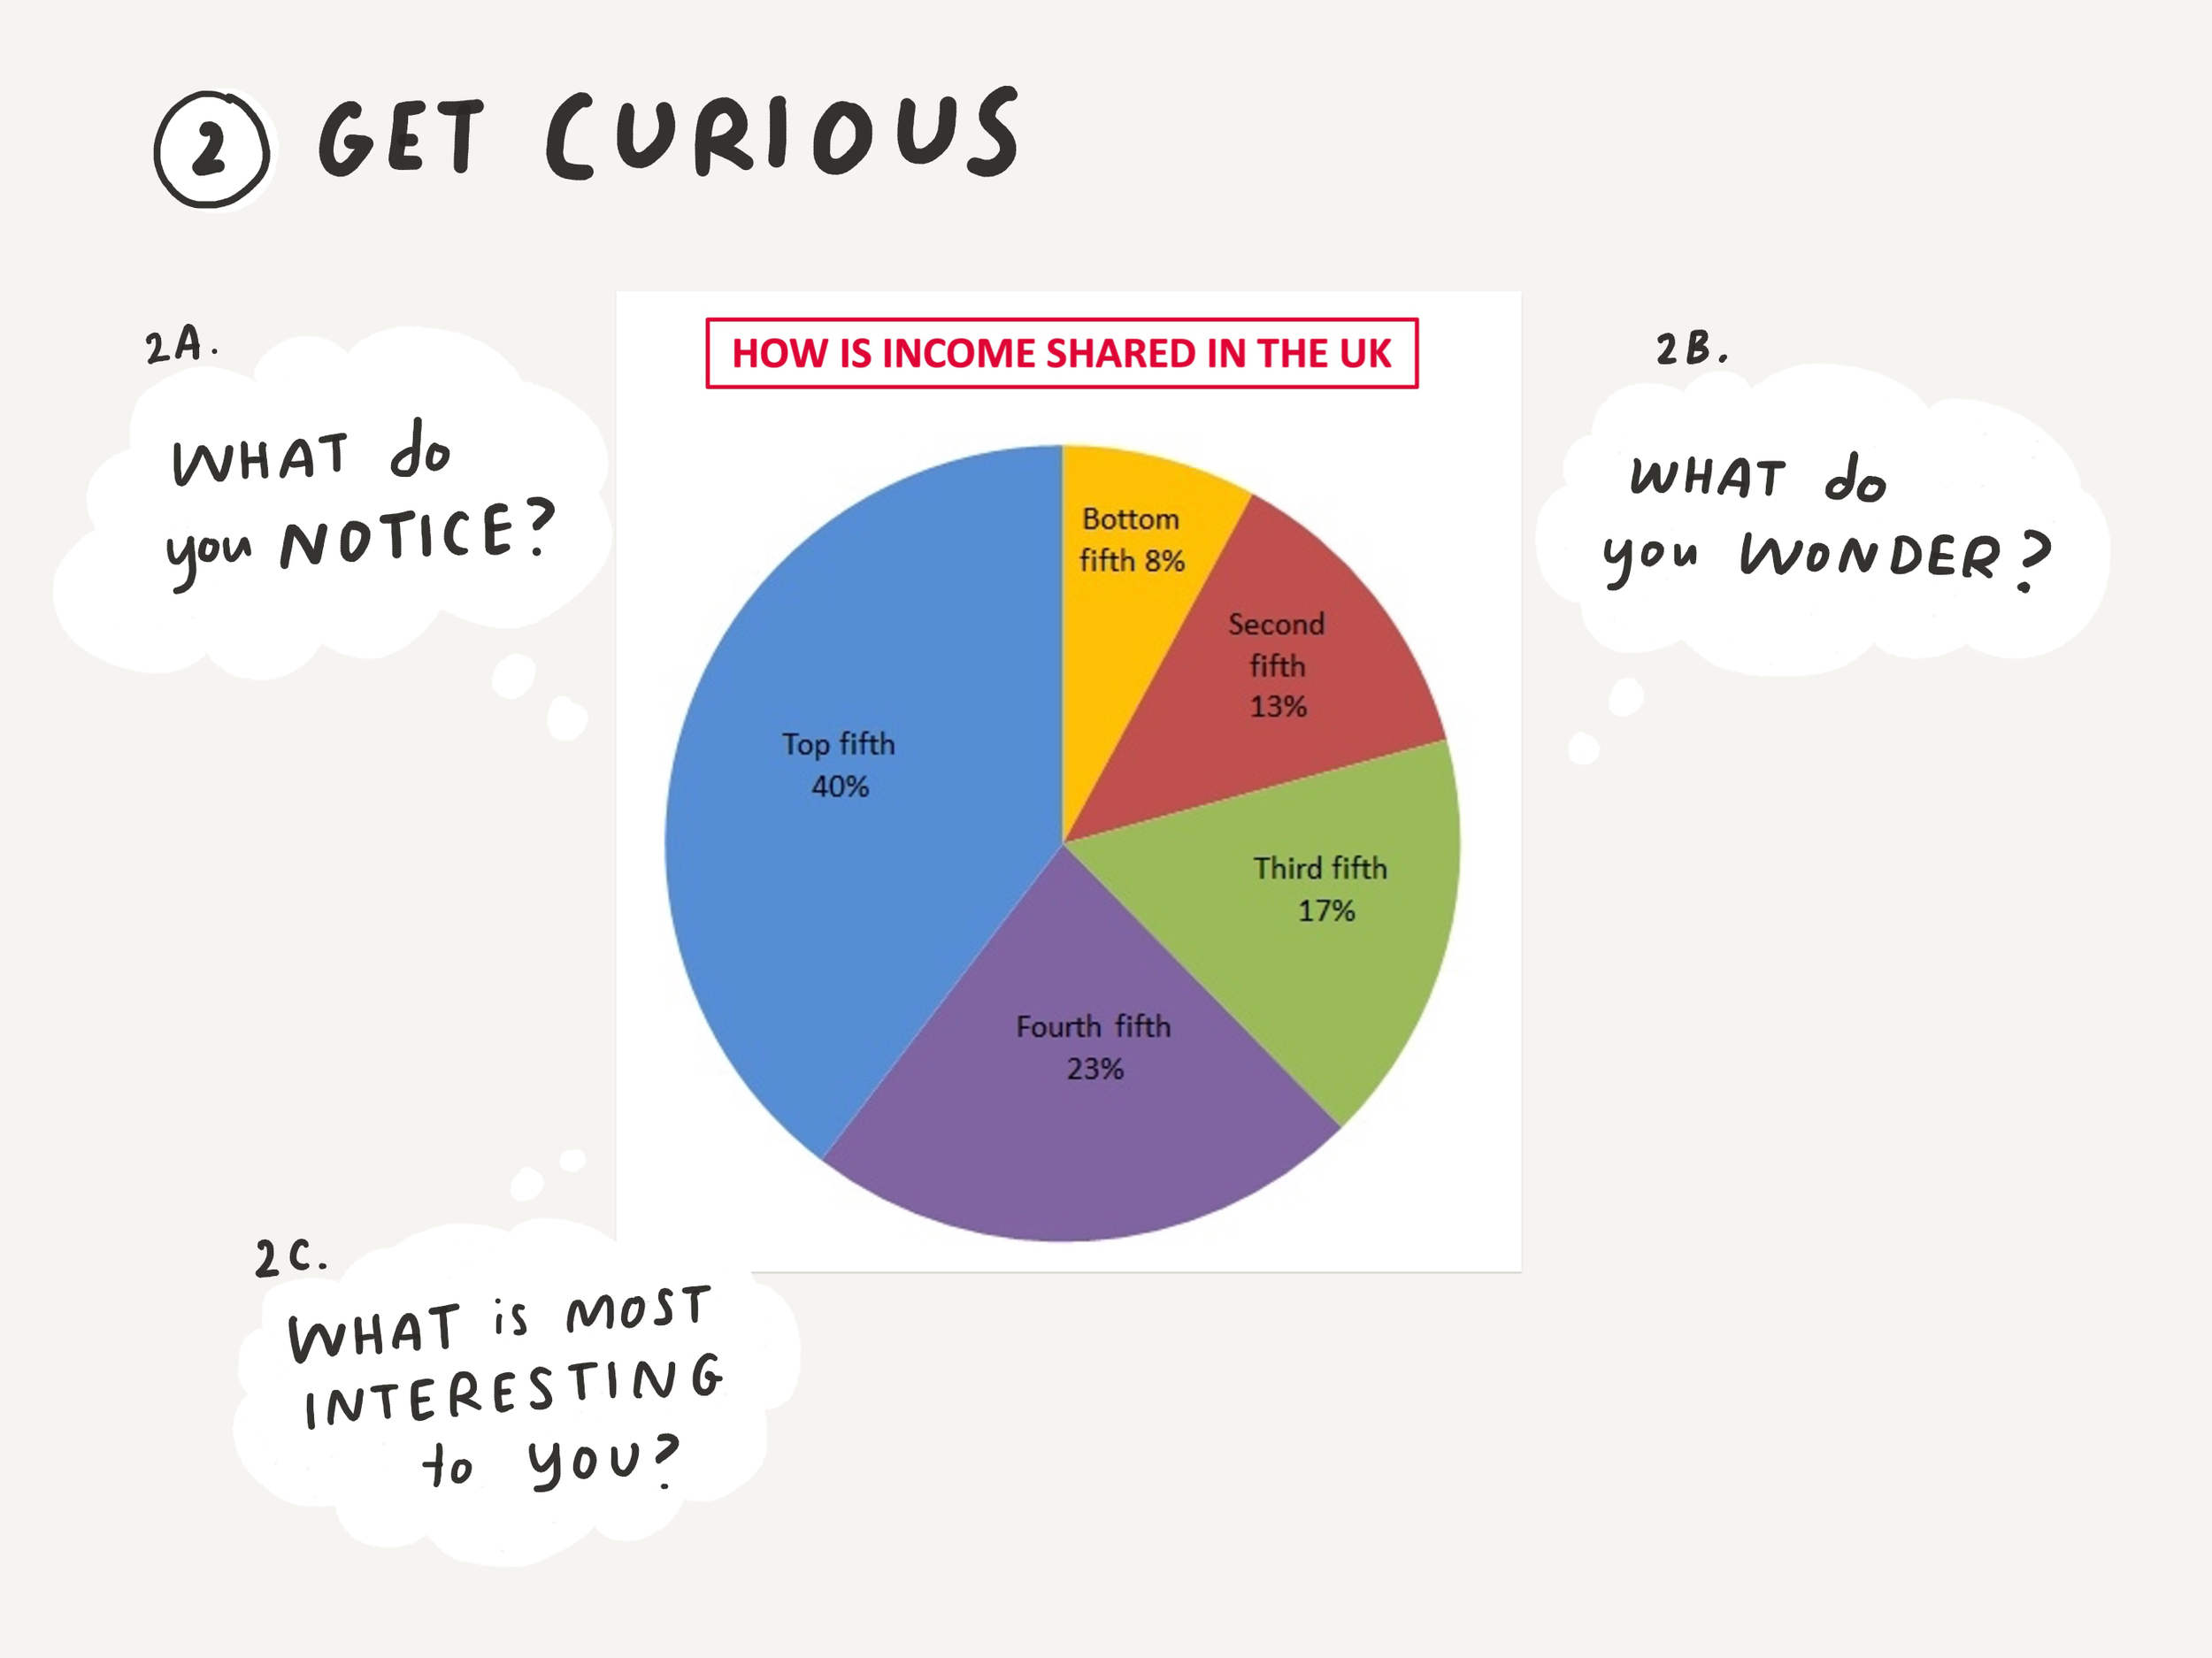
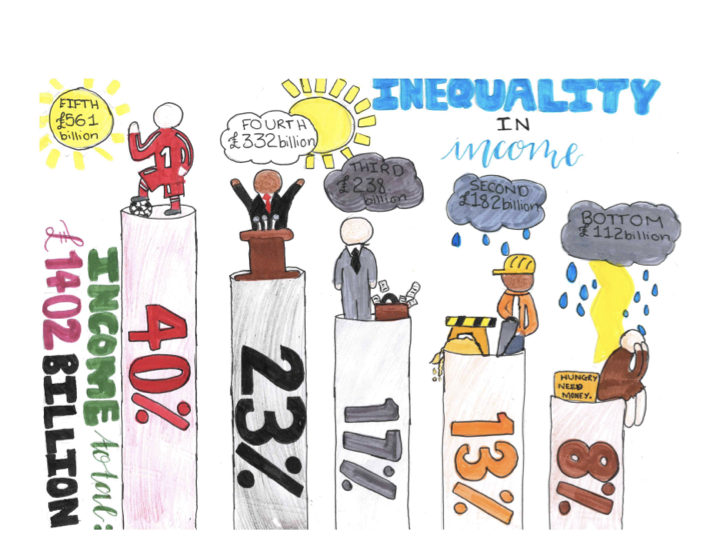
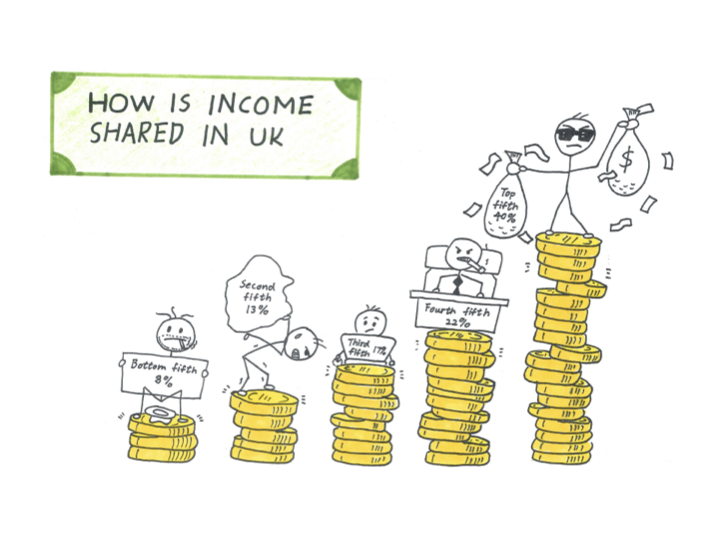
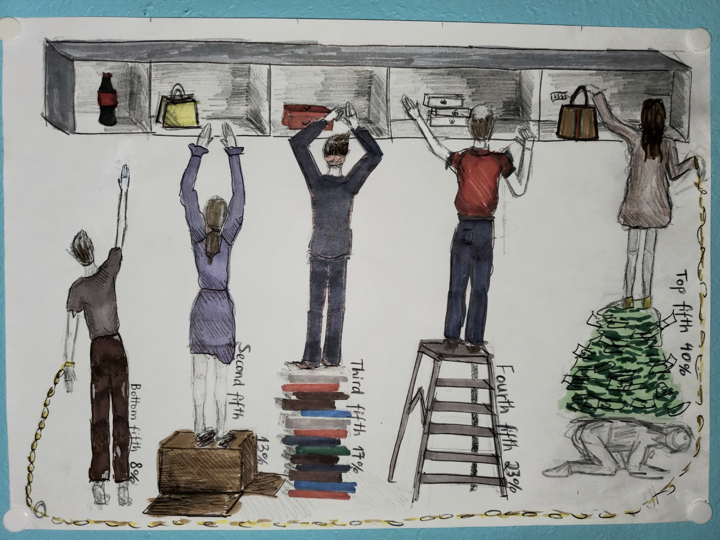
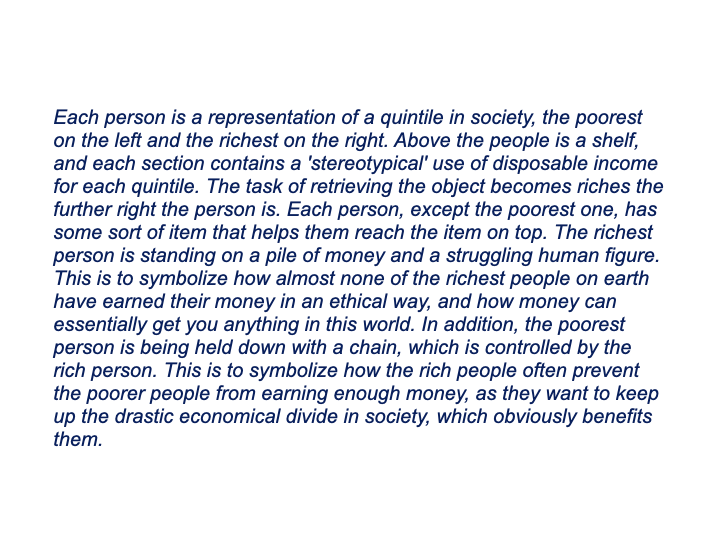
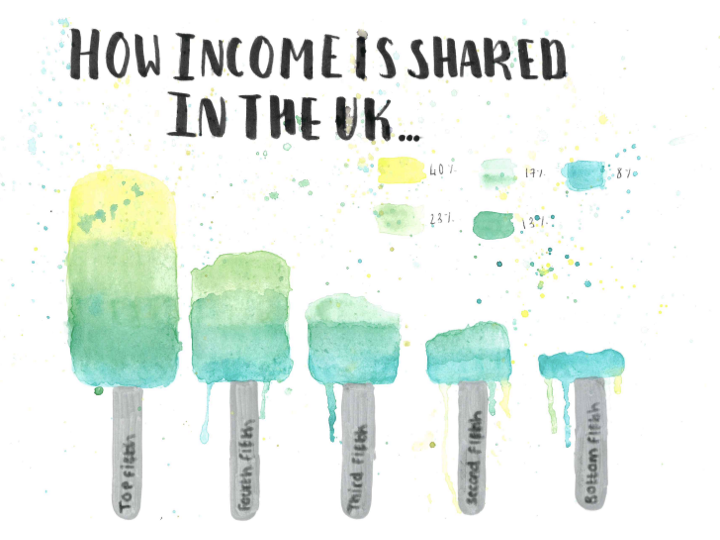
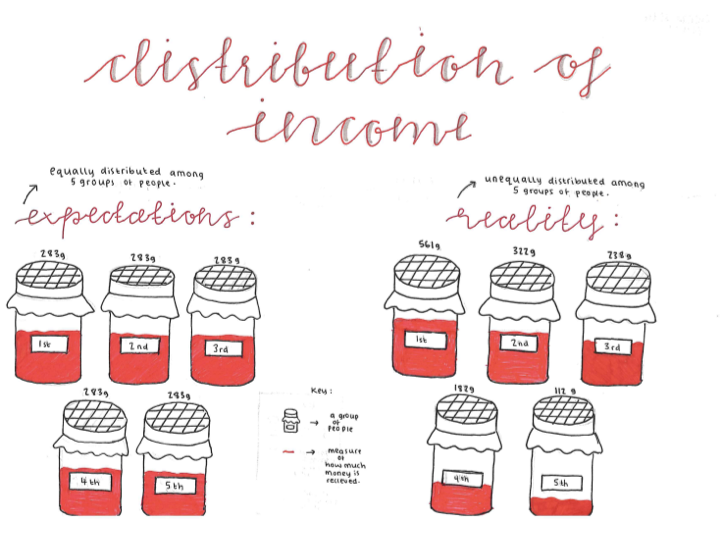
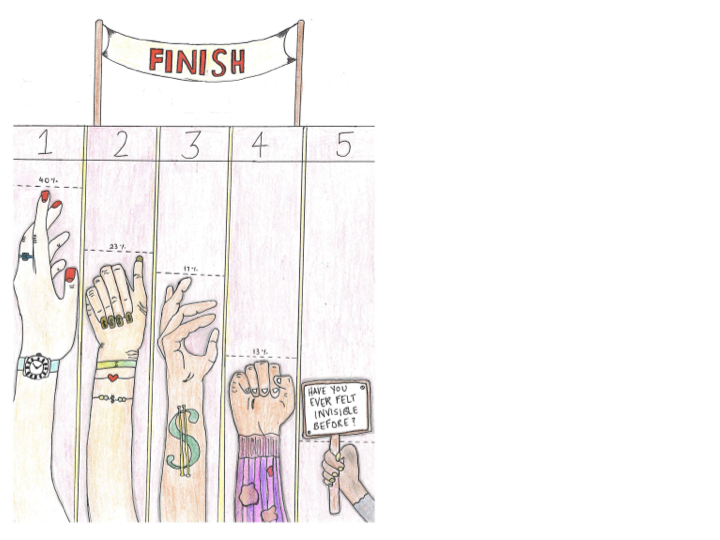
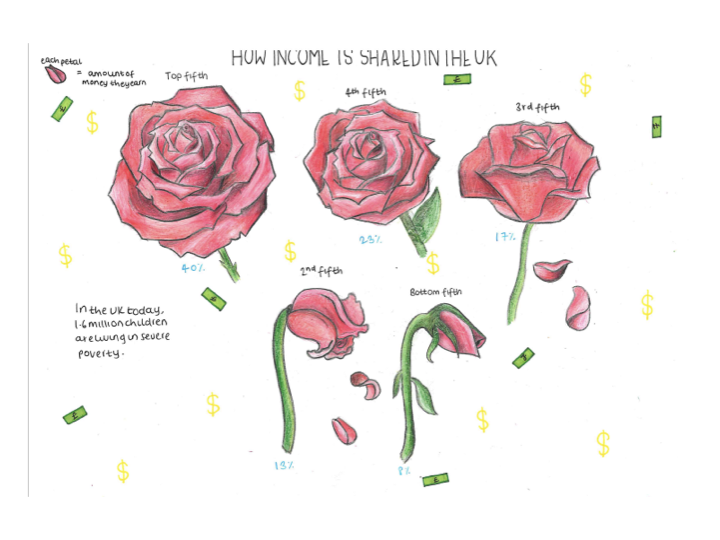
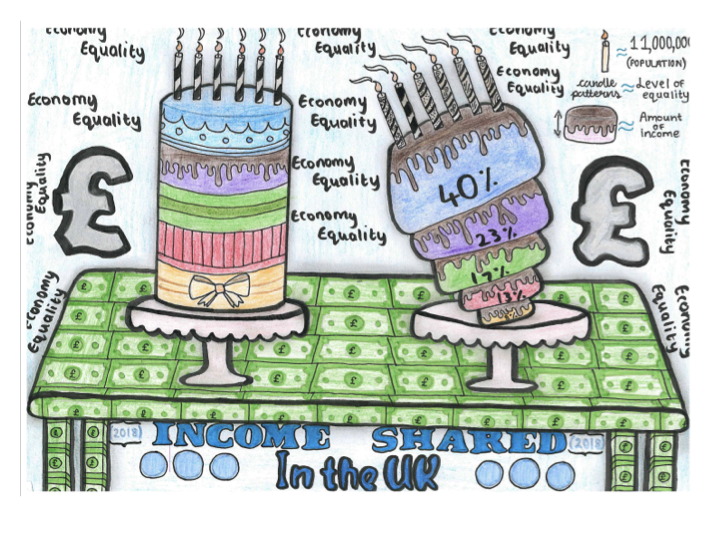
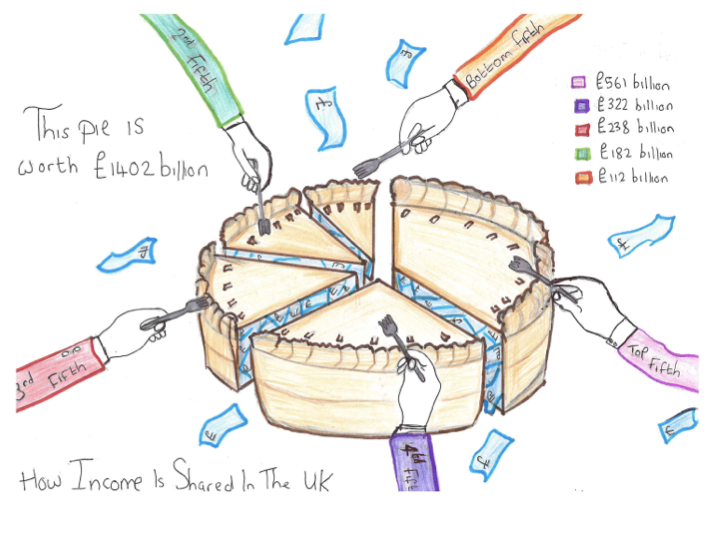
Integrate data provided in partnership with the Equality Trust that visualizes statistics on wealth and income inequality
Challenge students and teachers to create their own hand drawn data and submit to a contest as part of Maths Week England
Possibly provide them with additional resources to empower them further
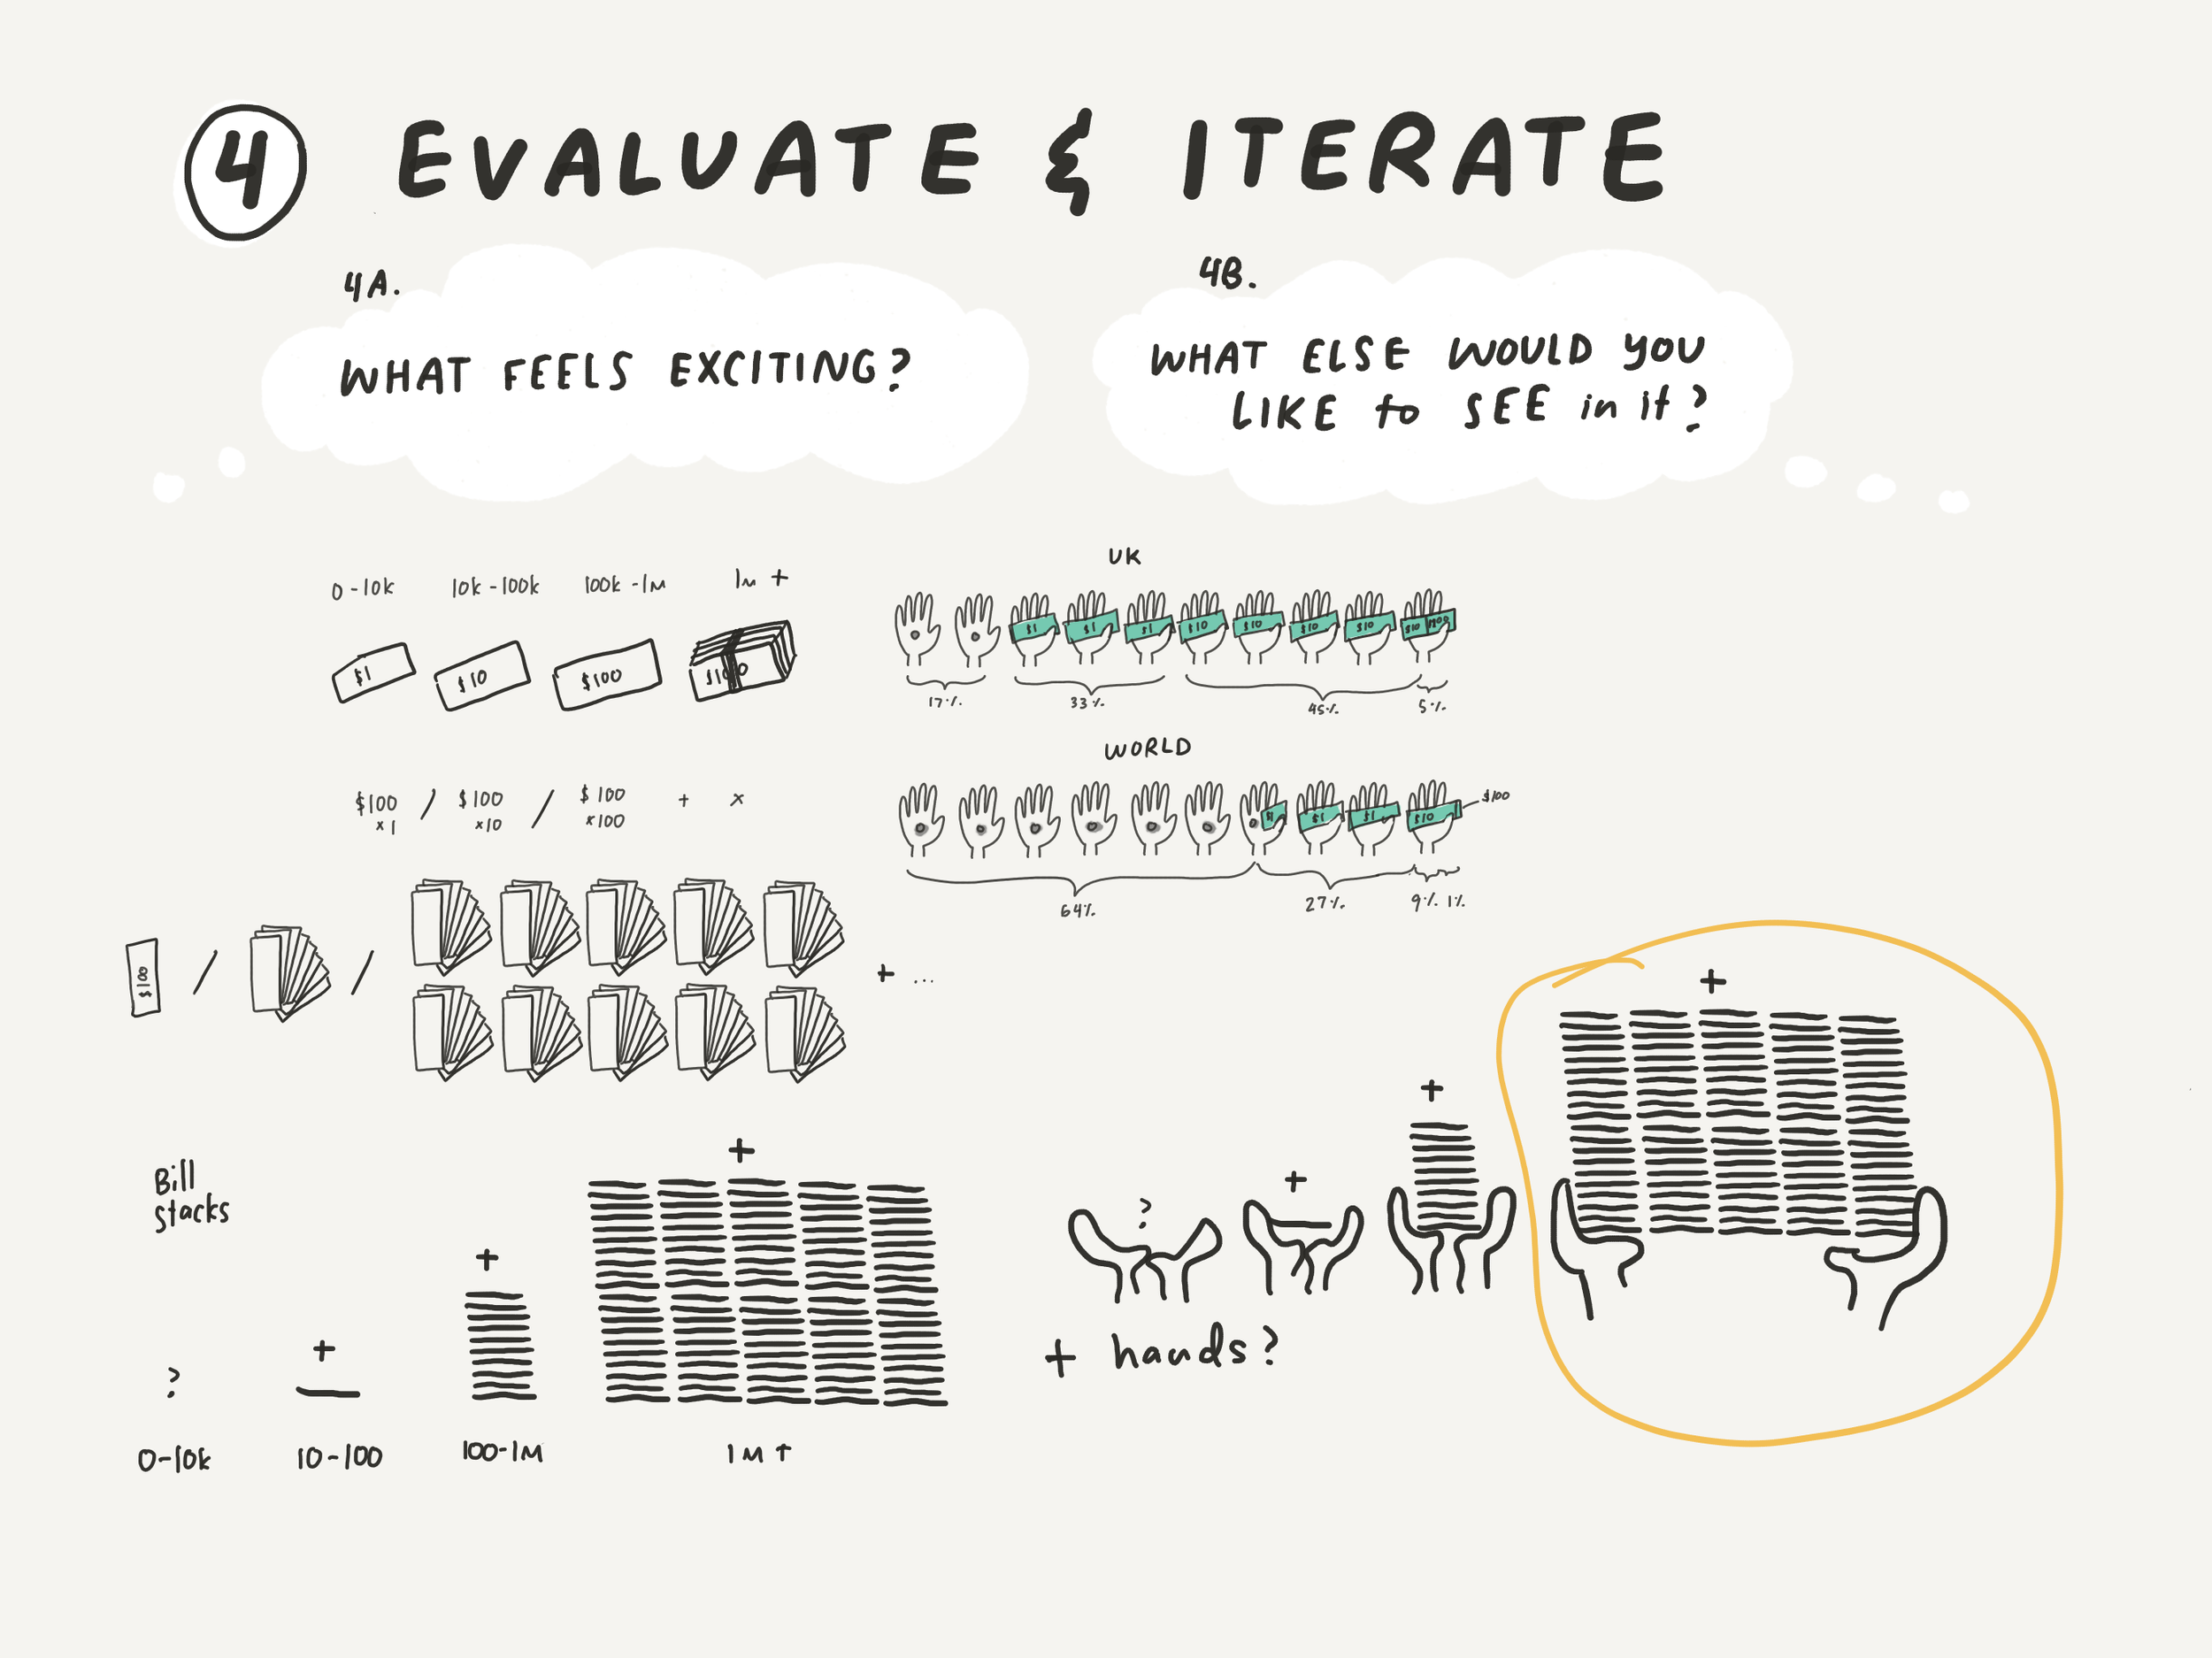
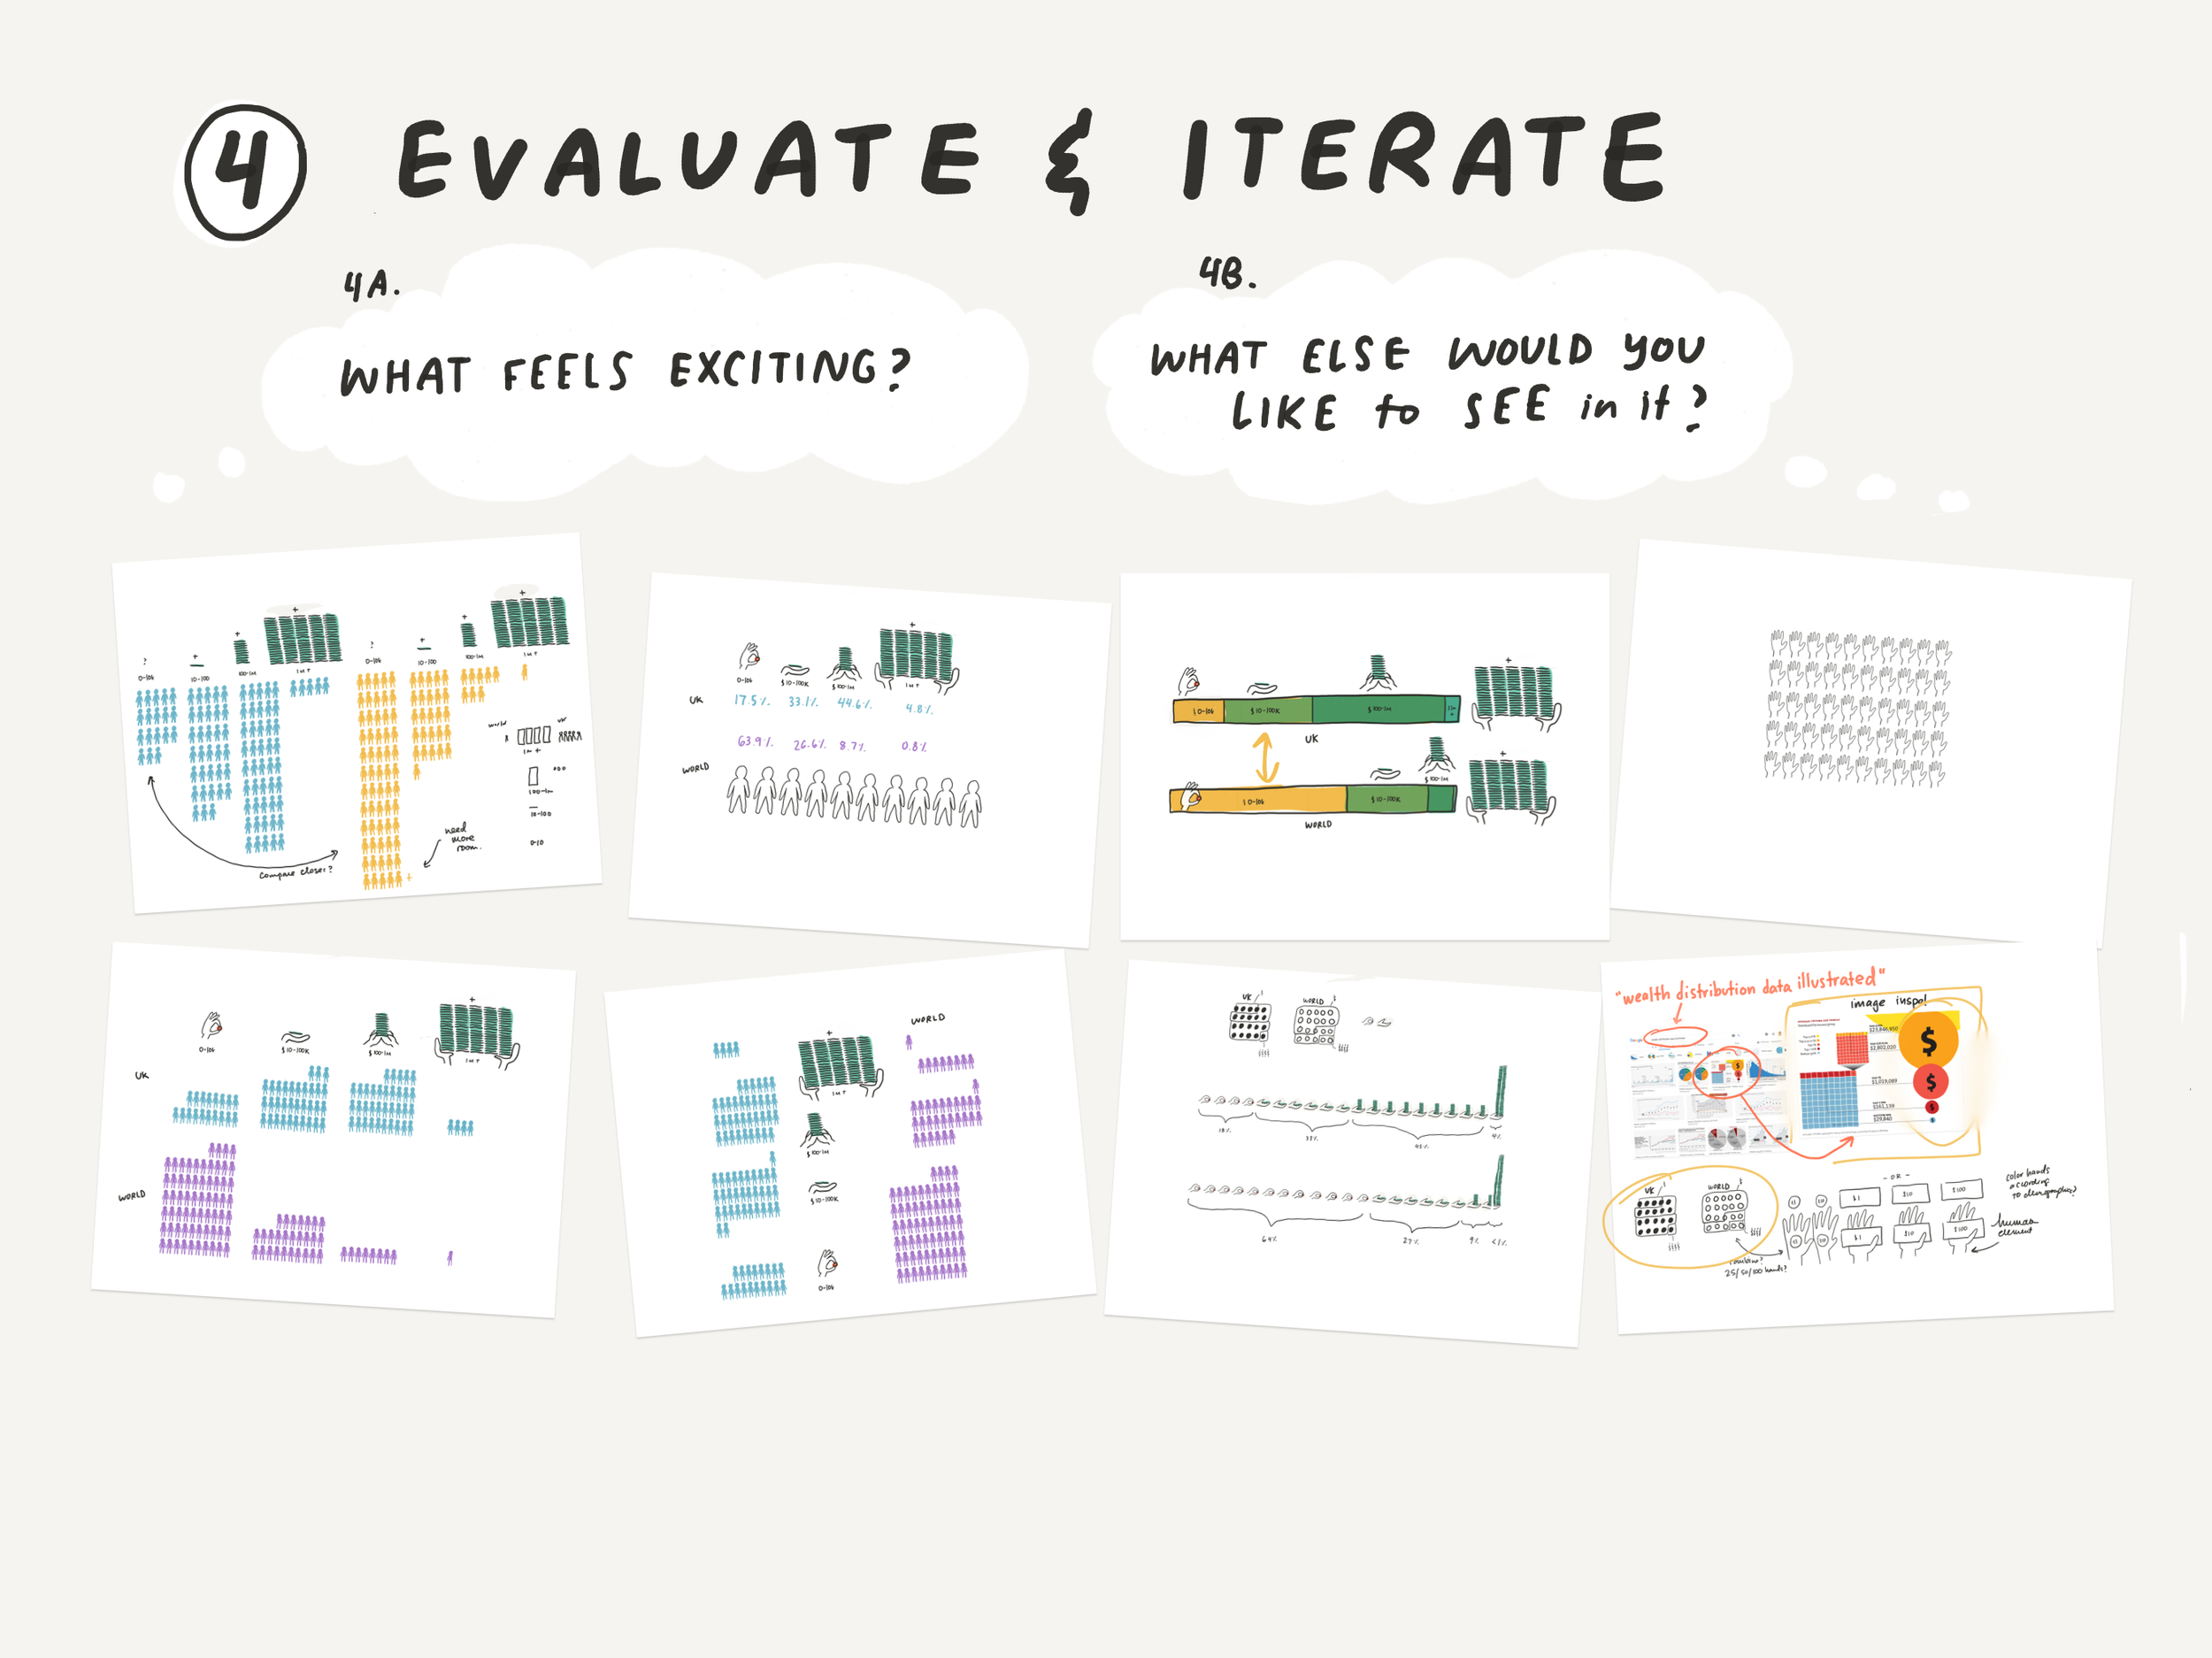
Here are some questions we grappled with (and solutions we arrived at along the way):
How do we set teachers and students up to succeed in the contest?
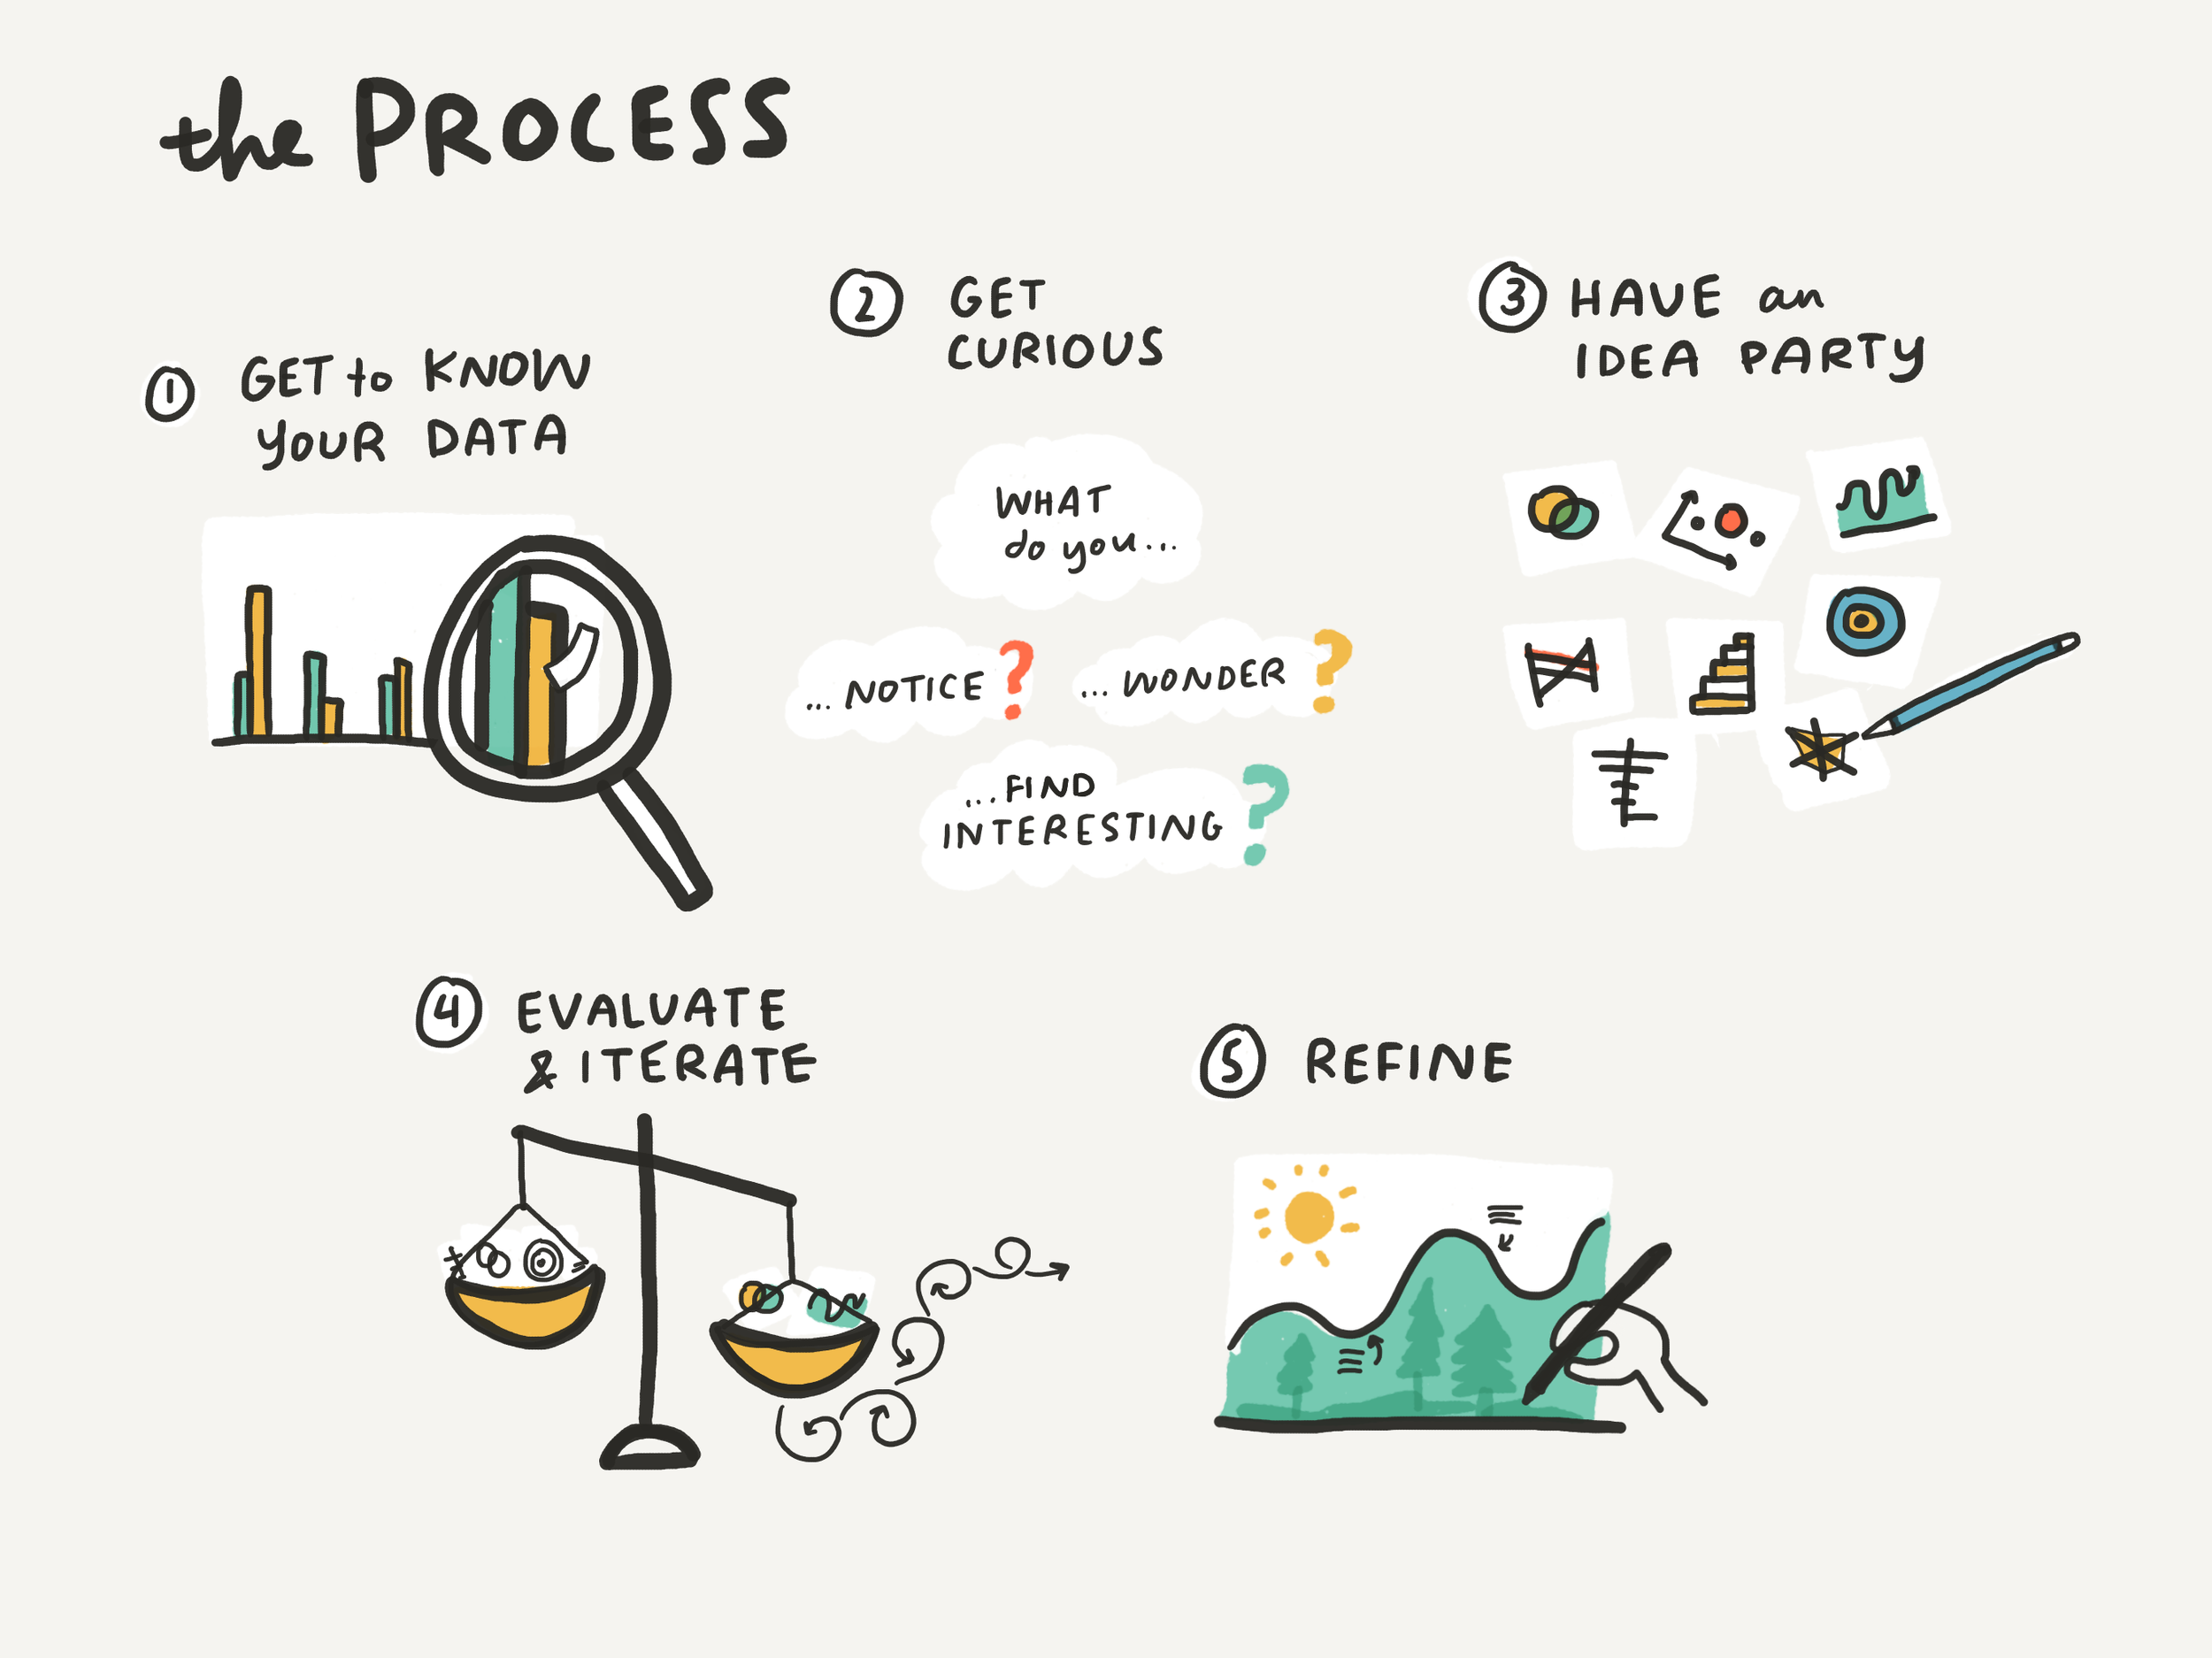
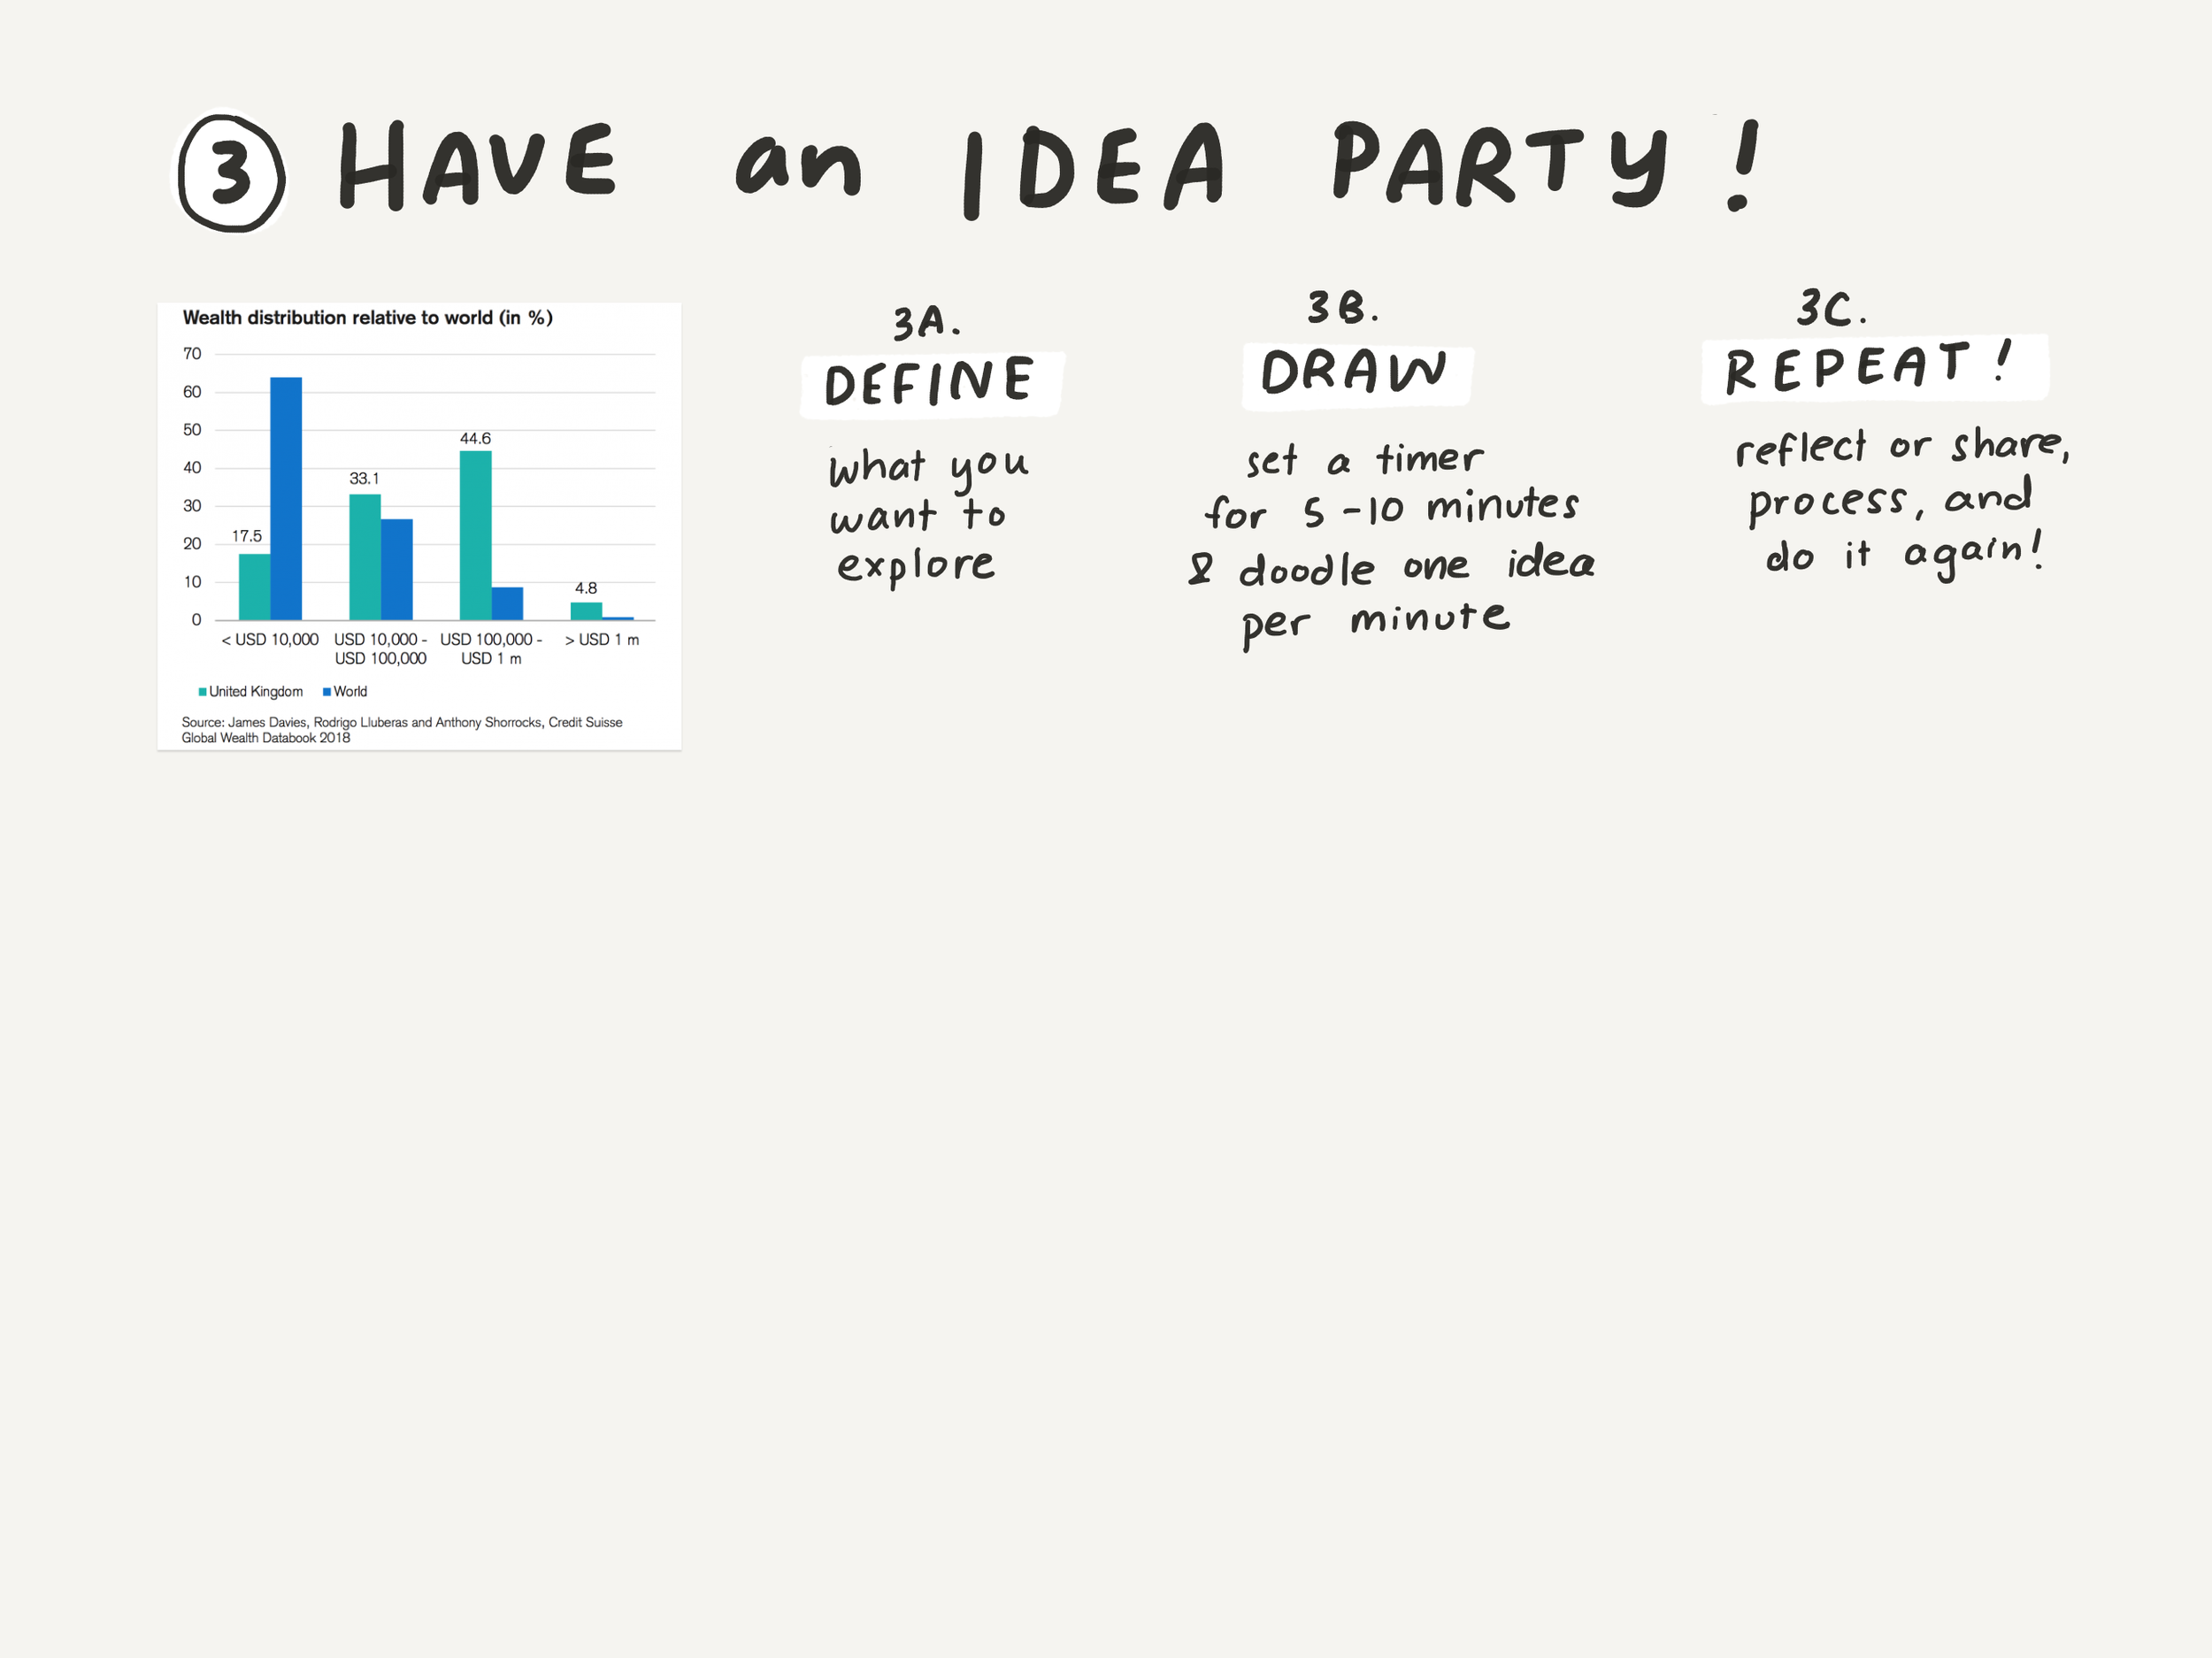
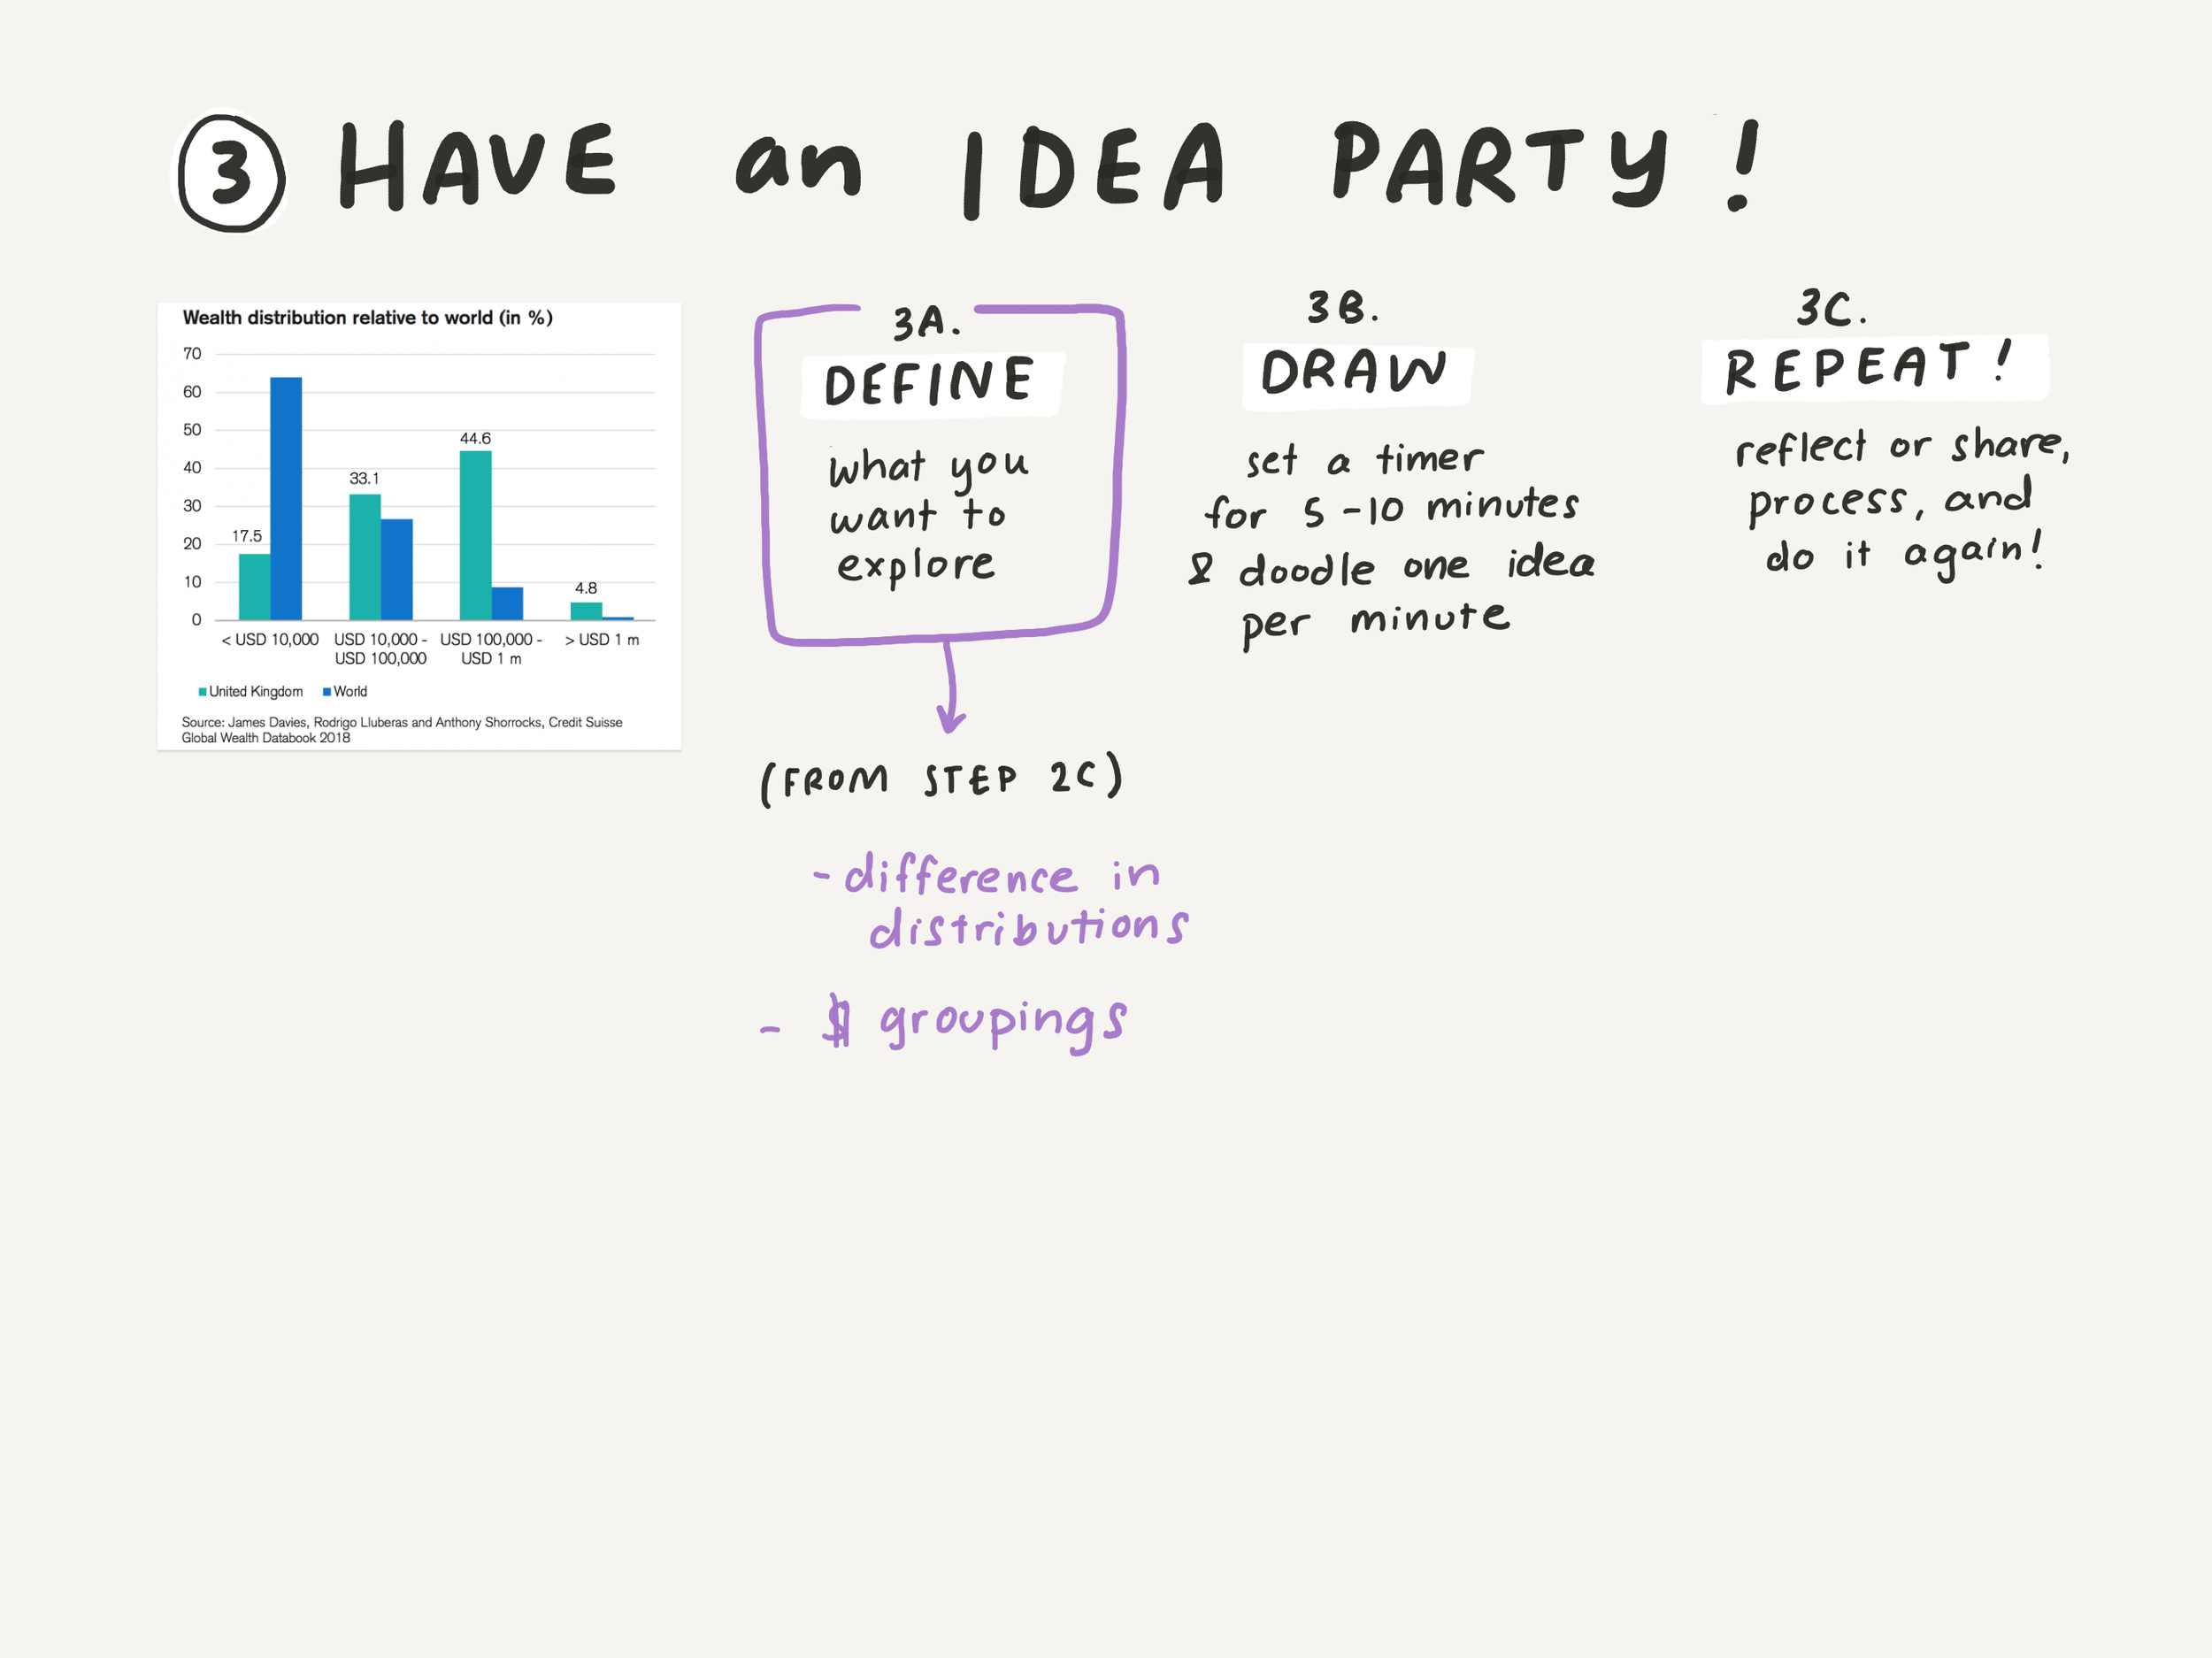
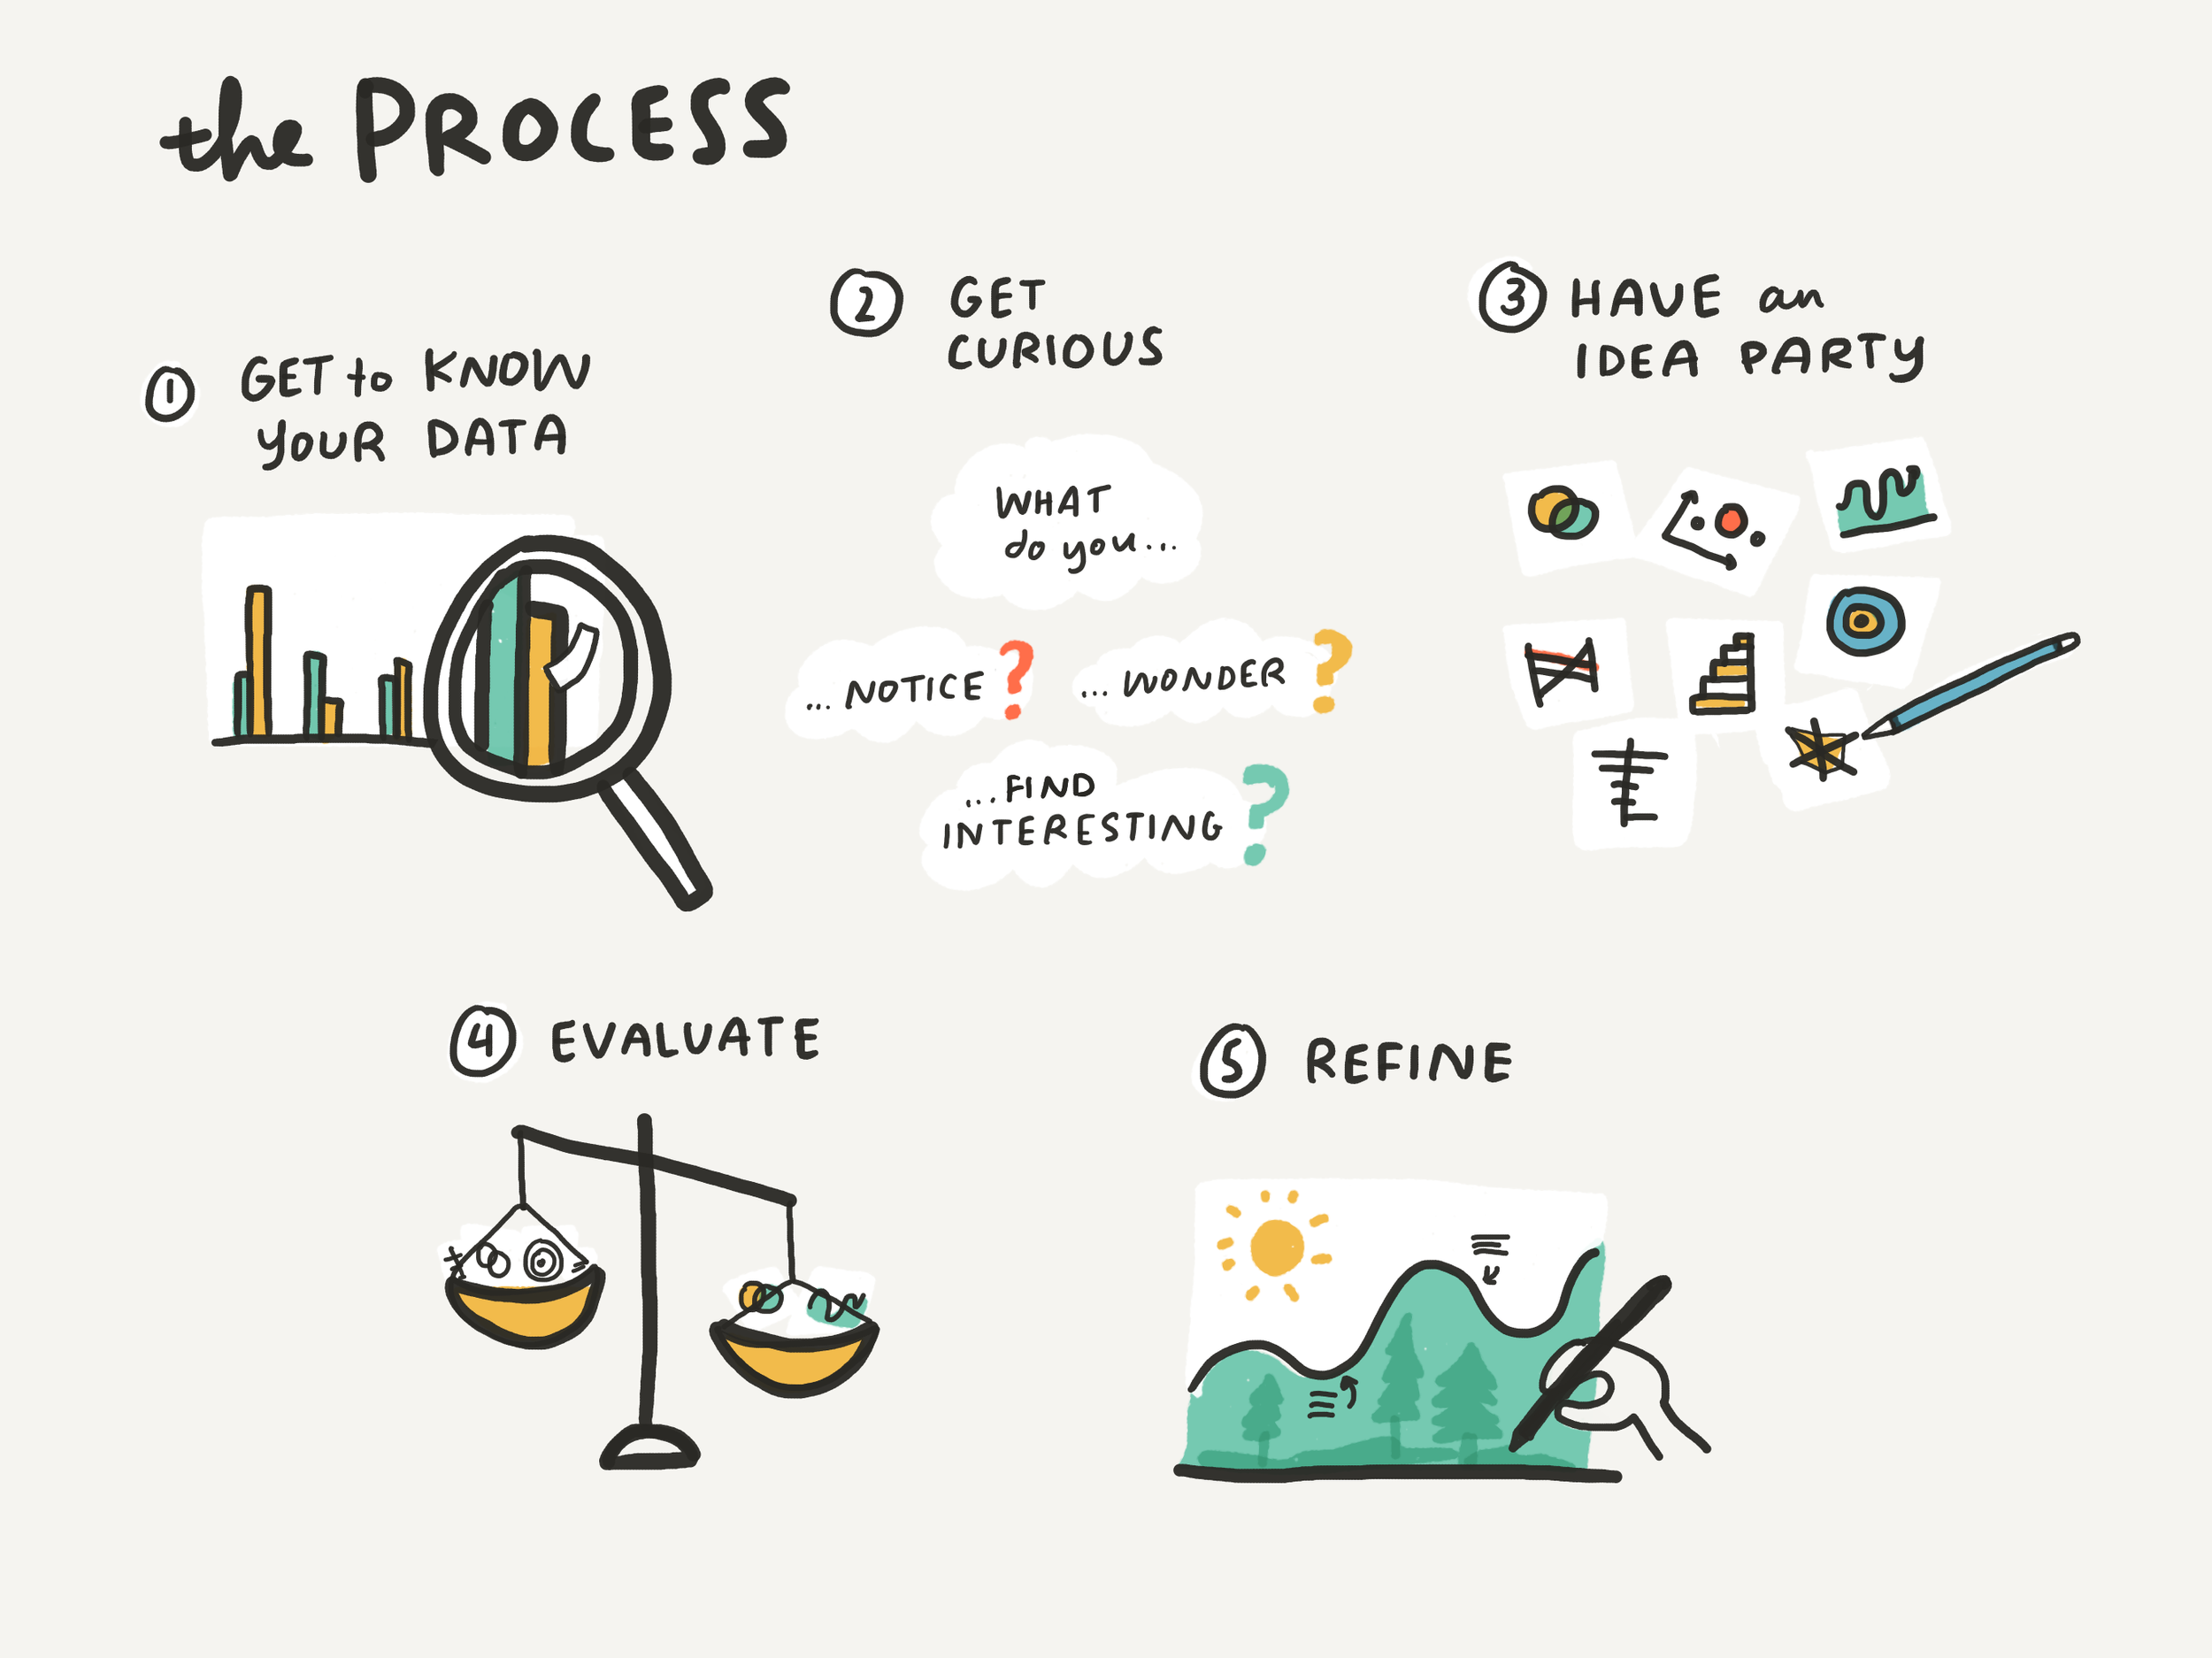
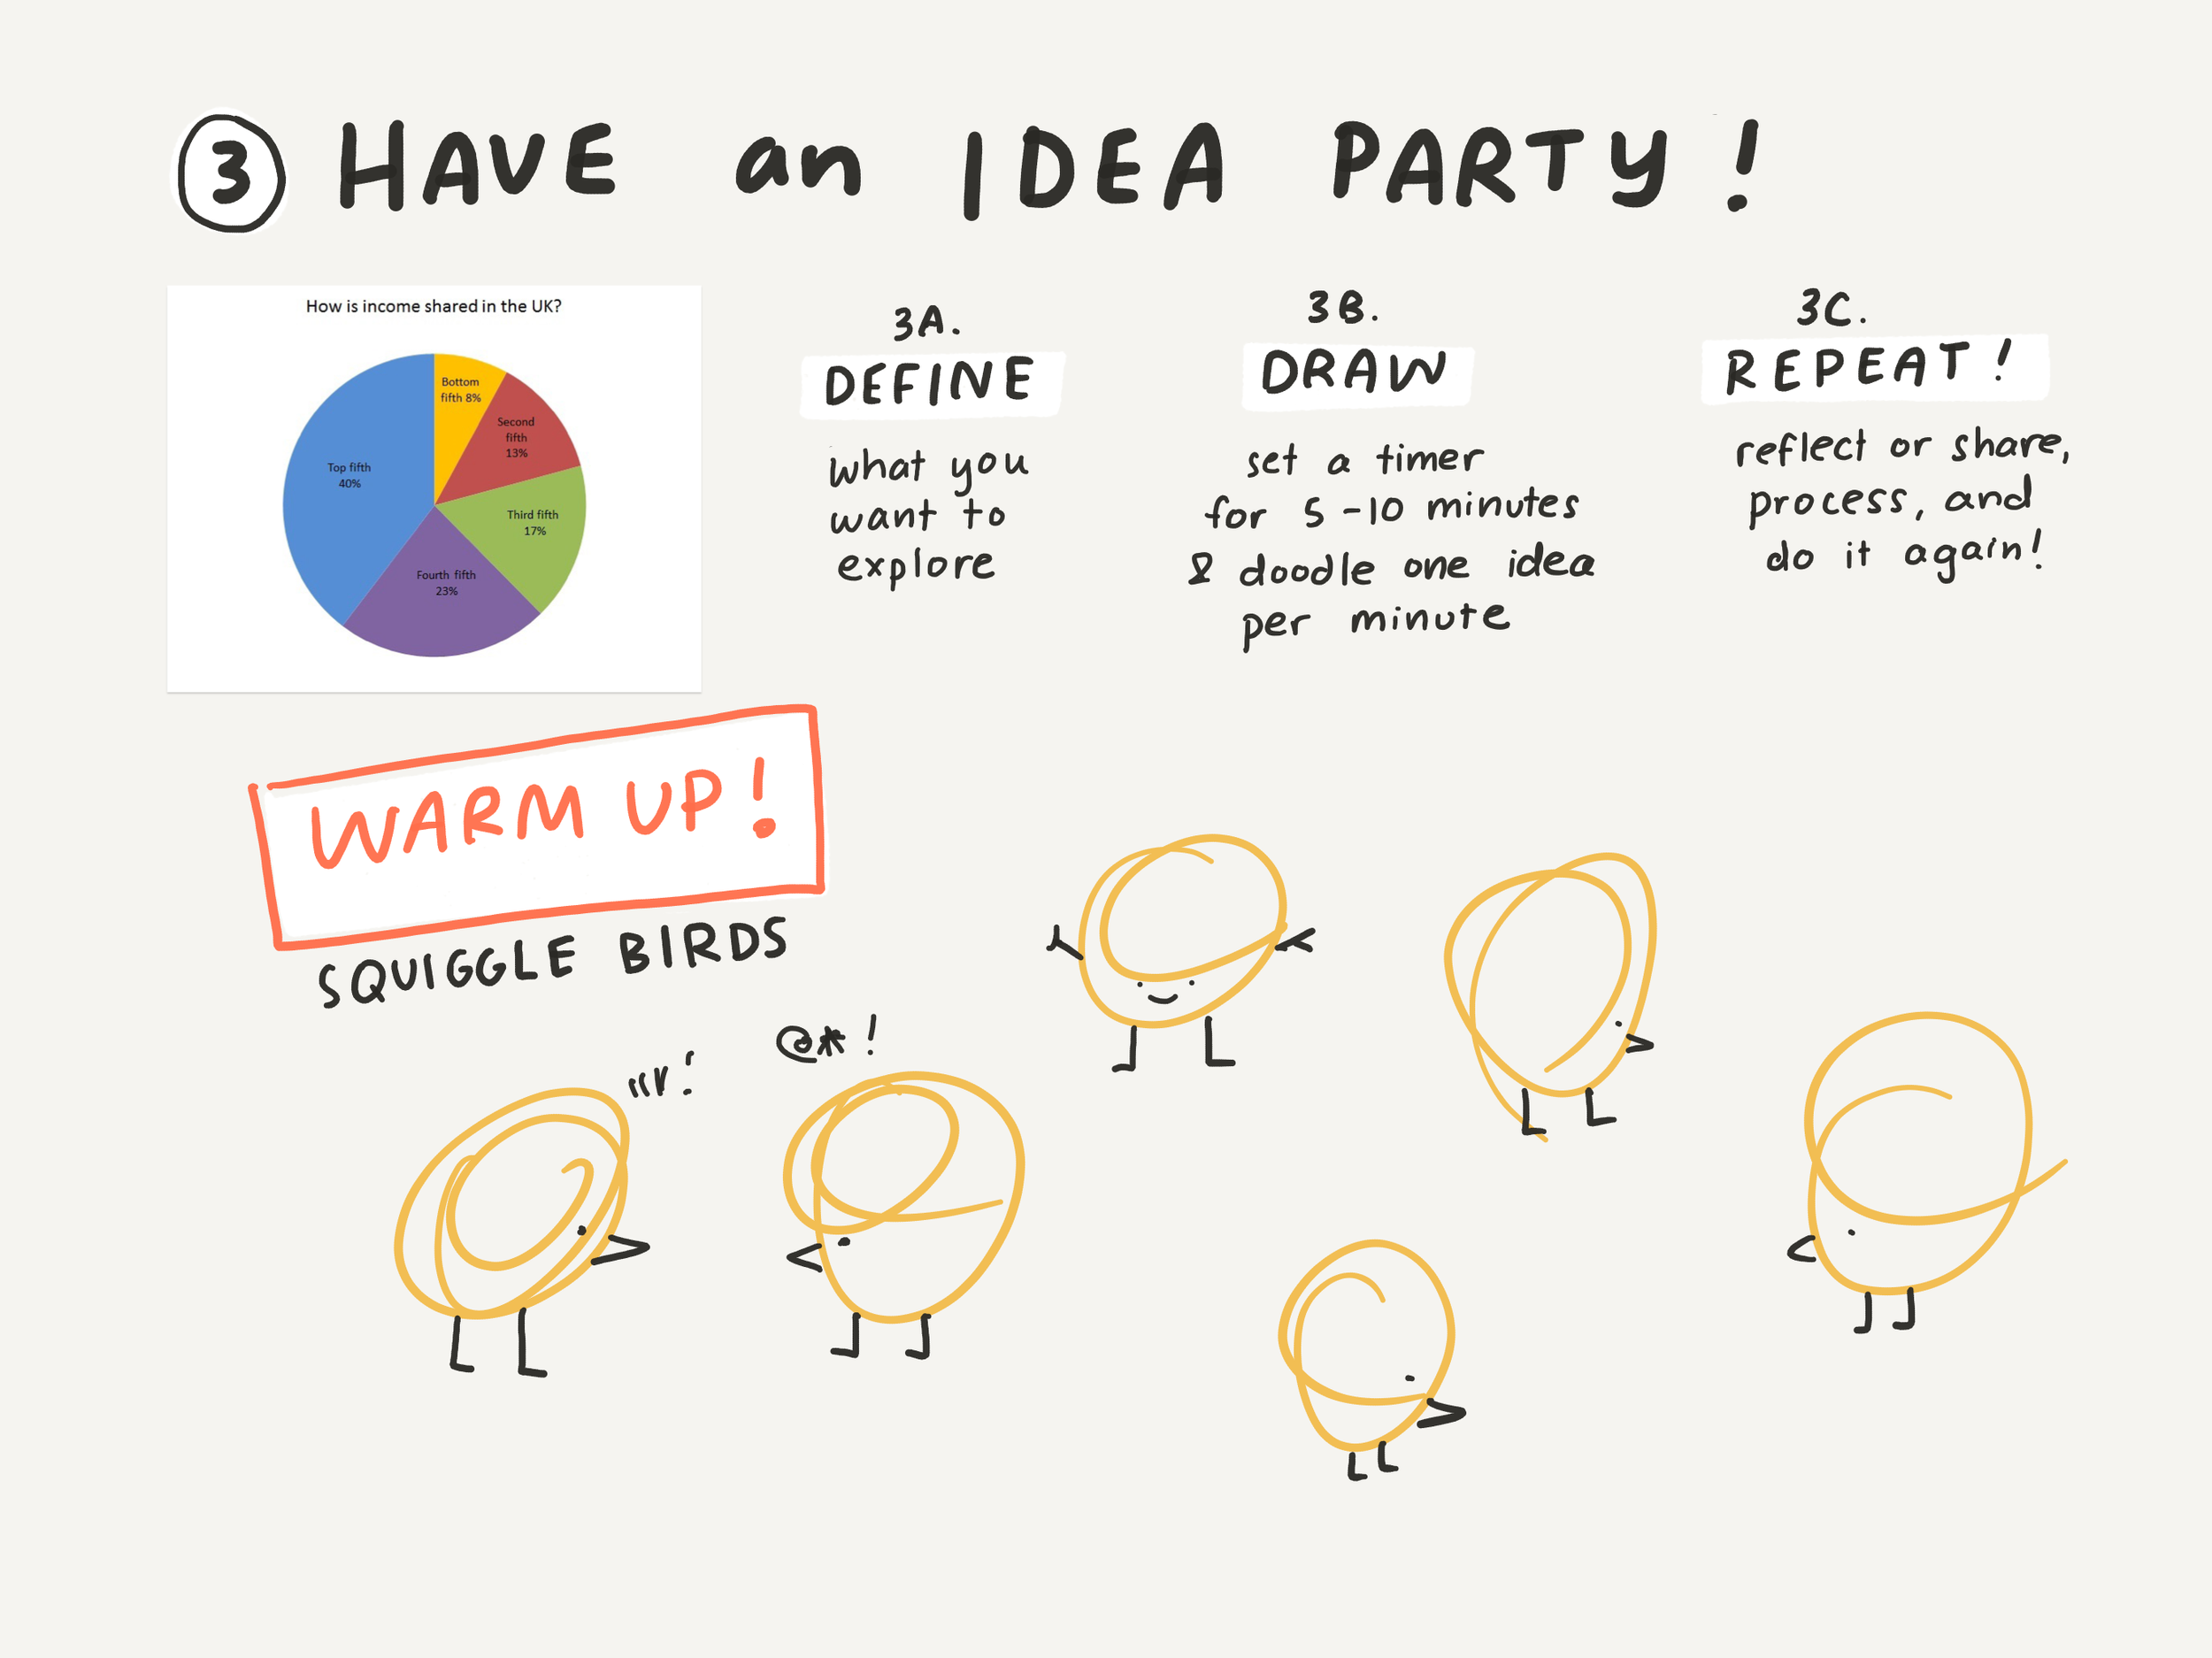
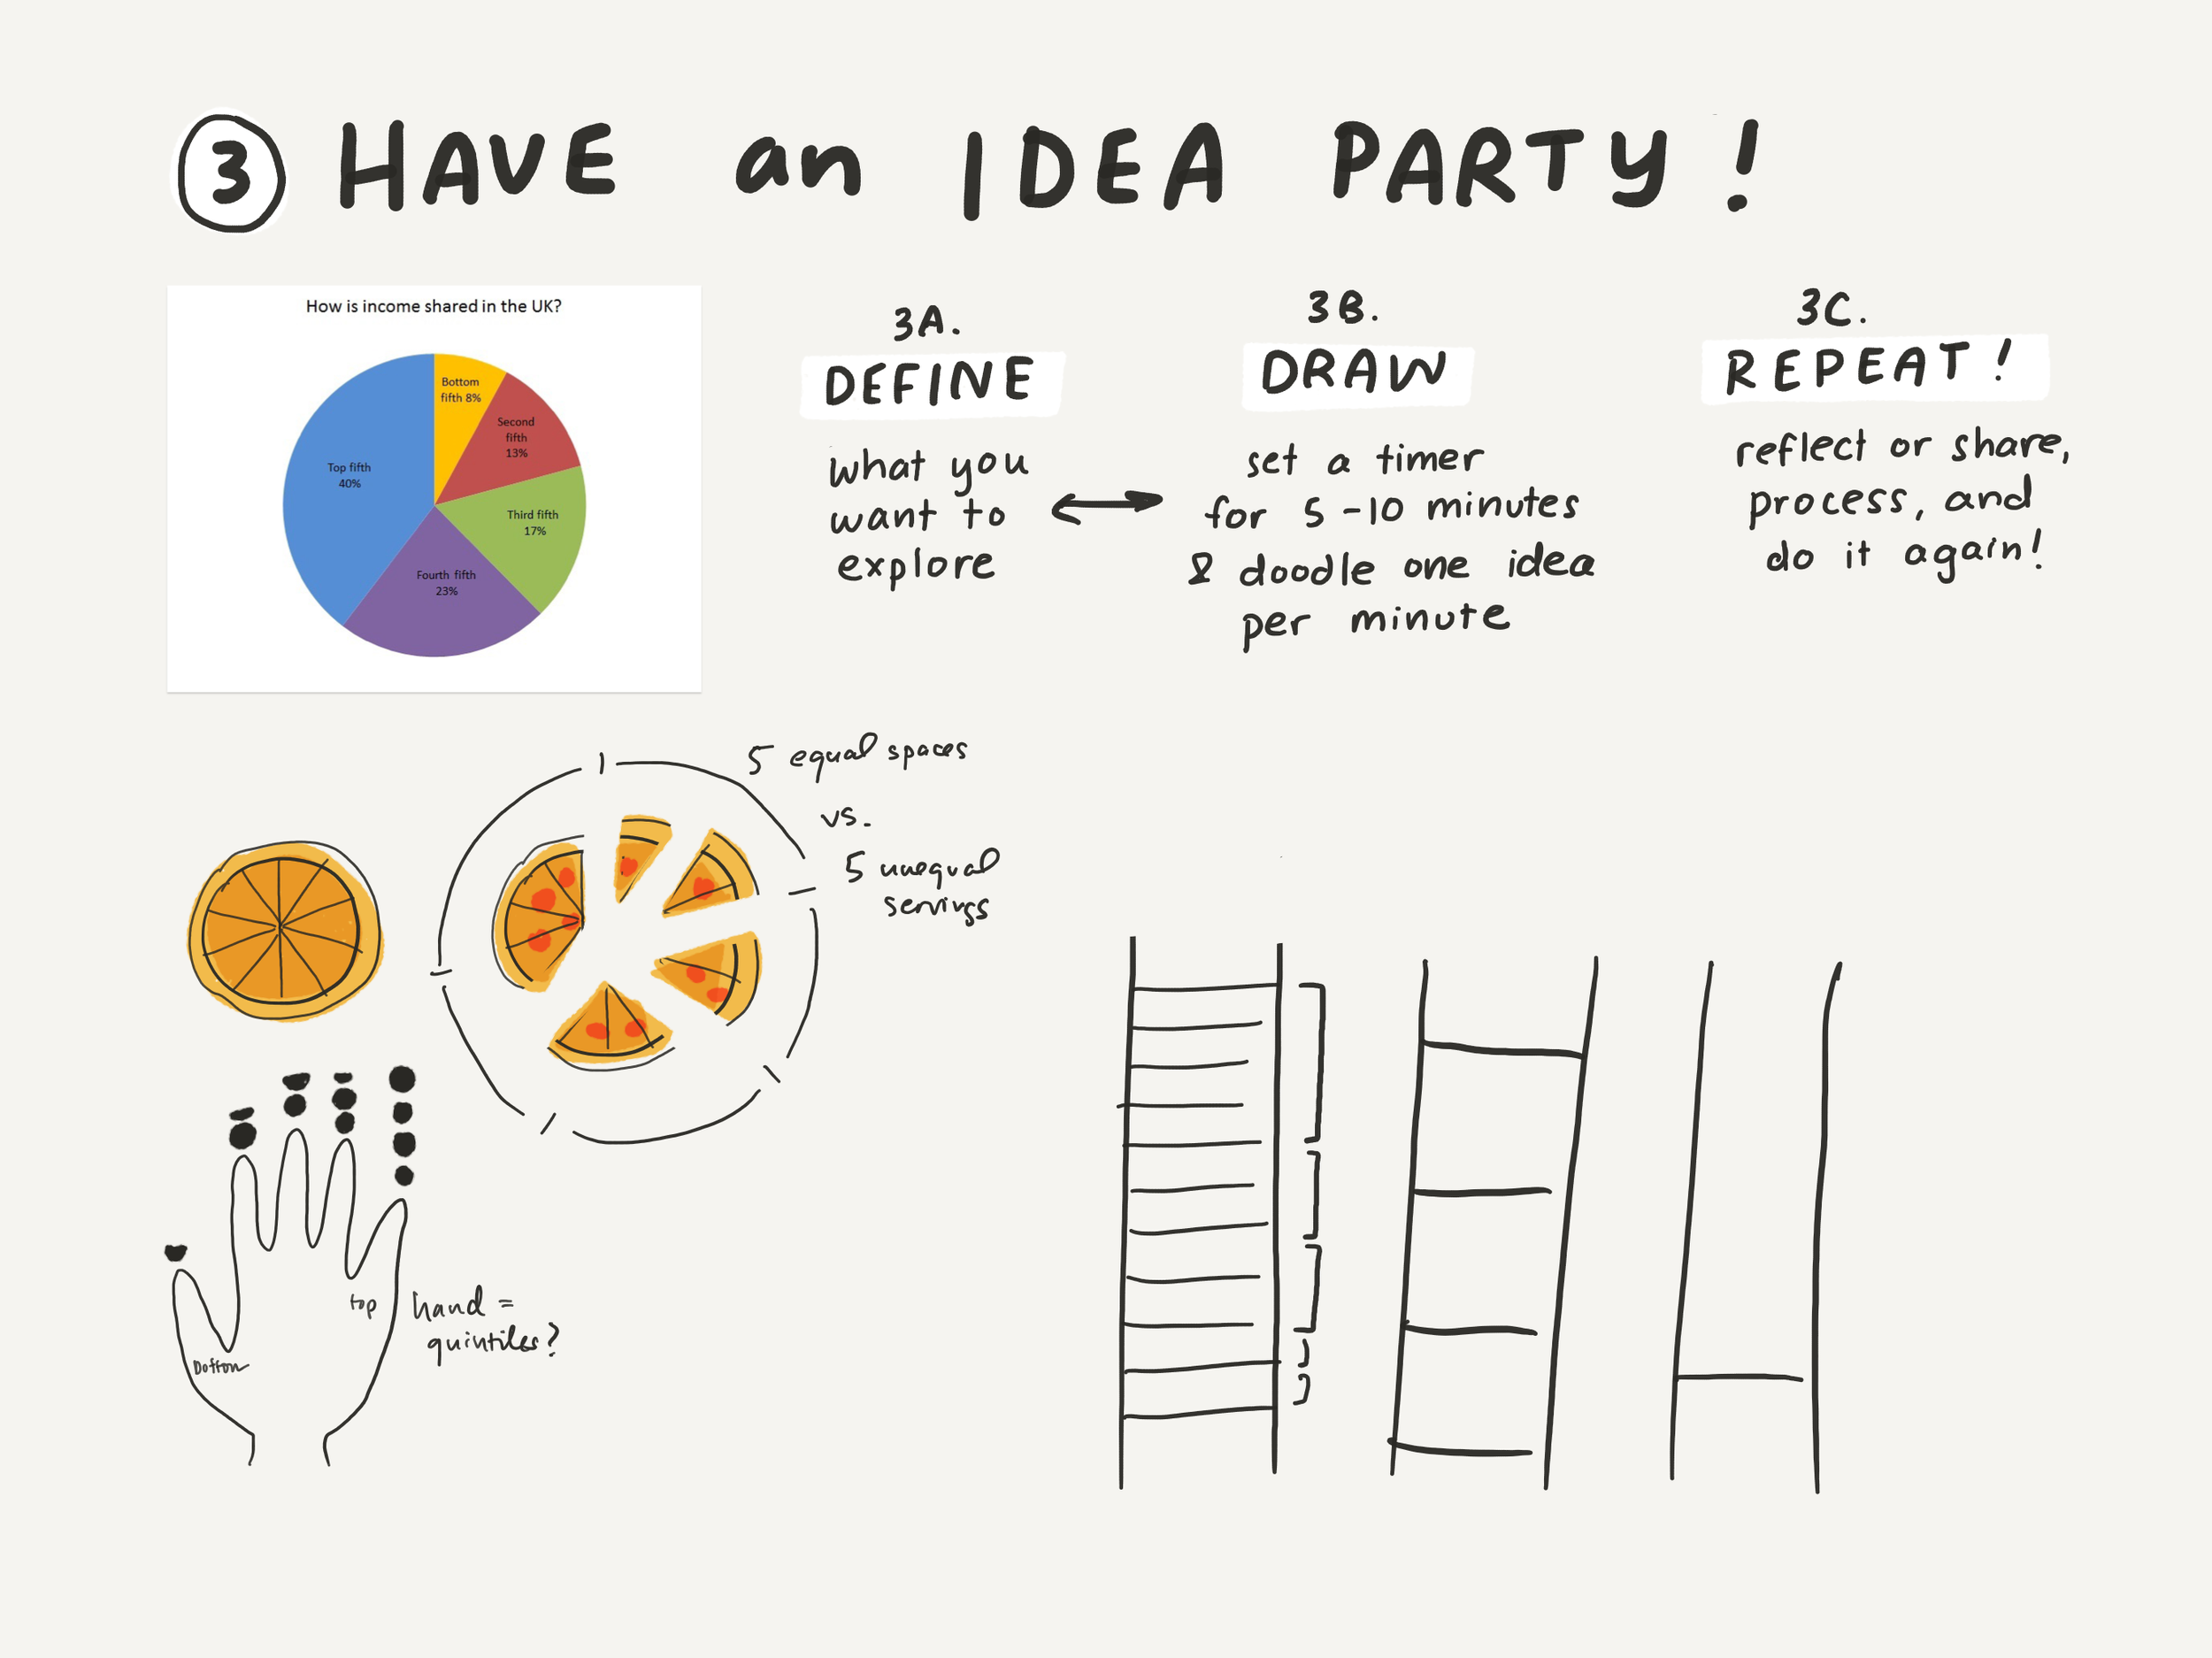
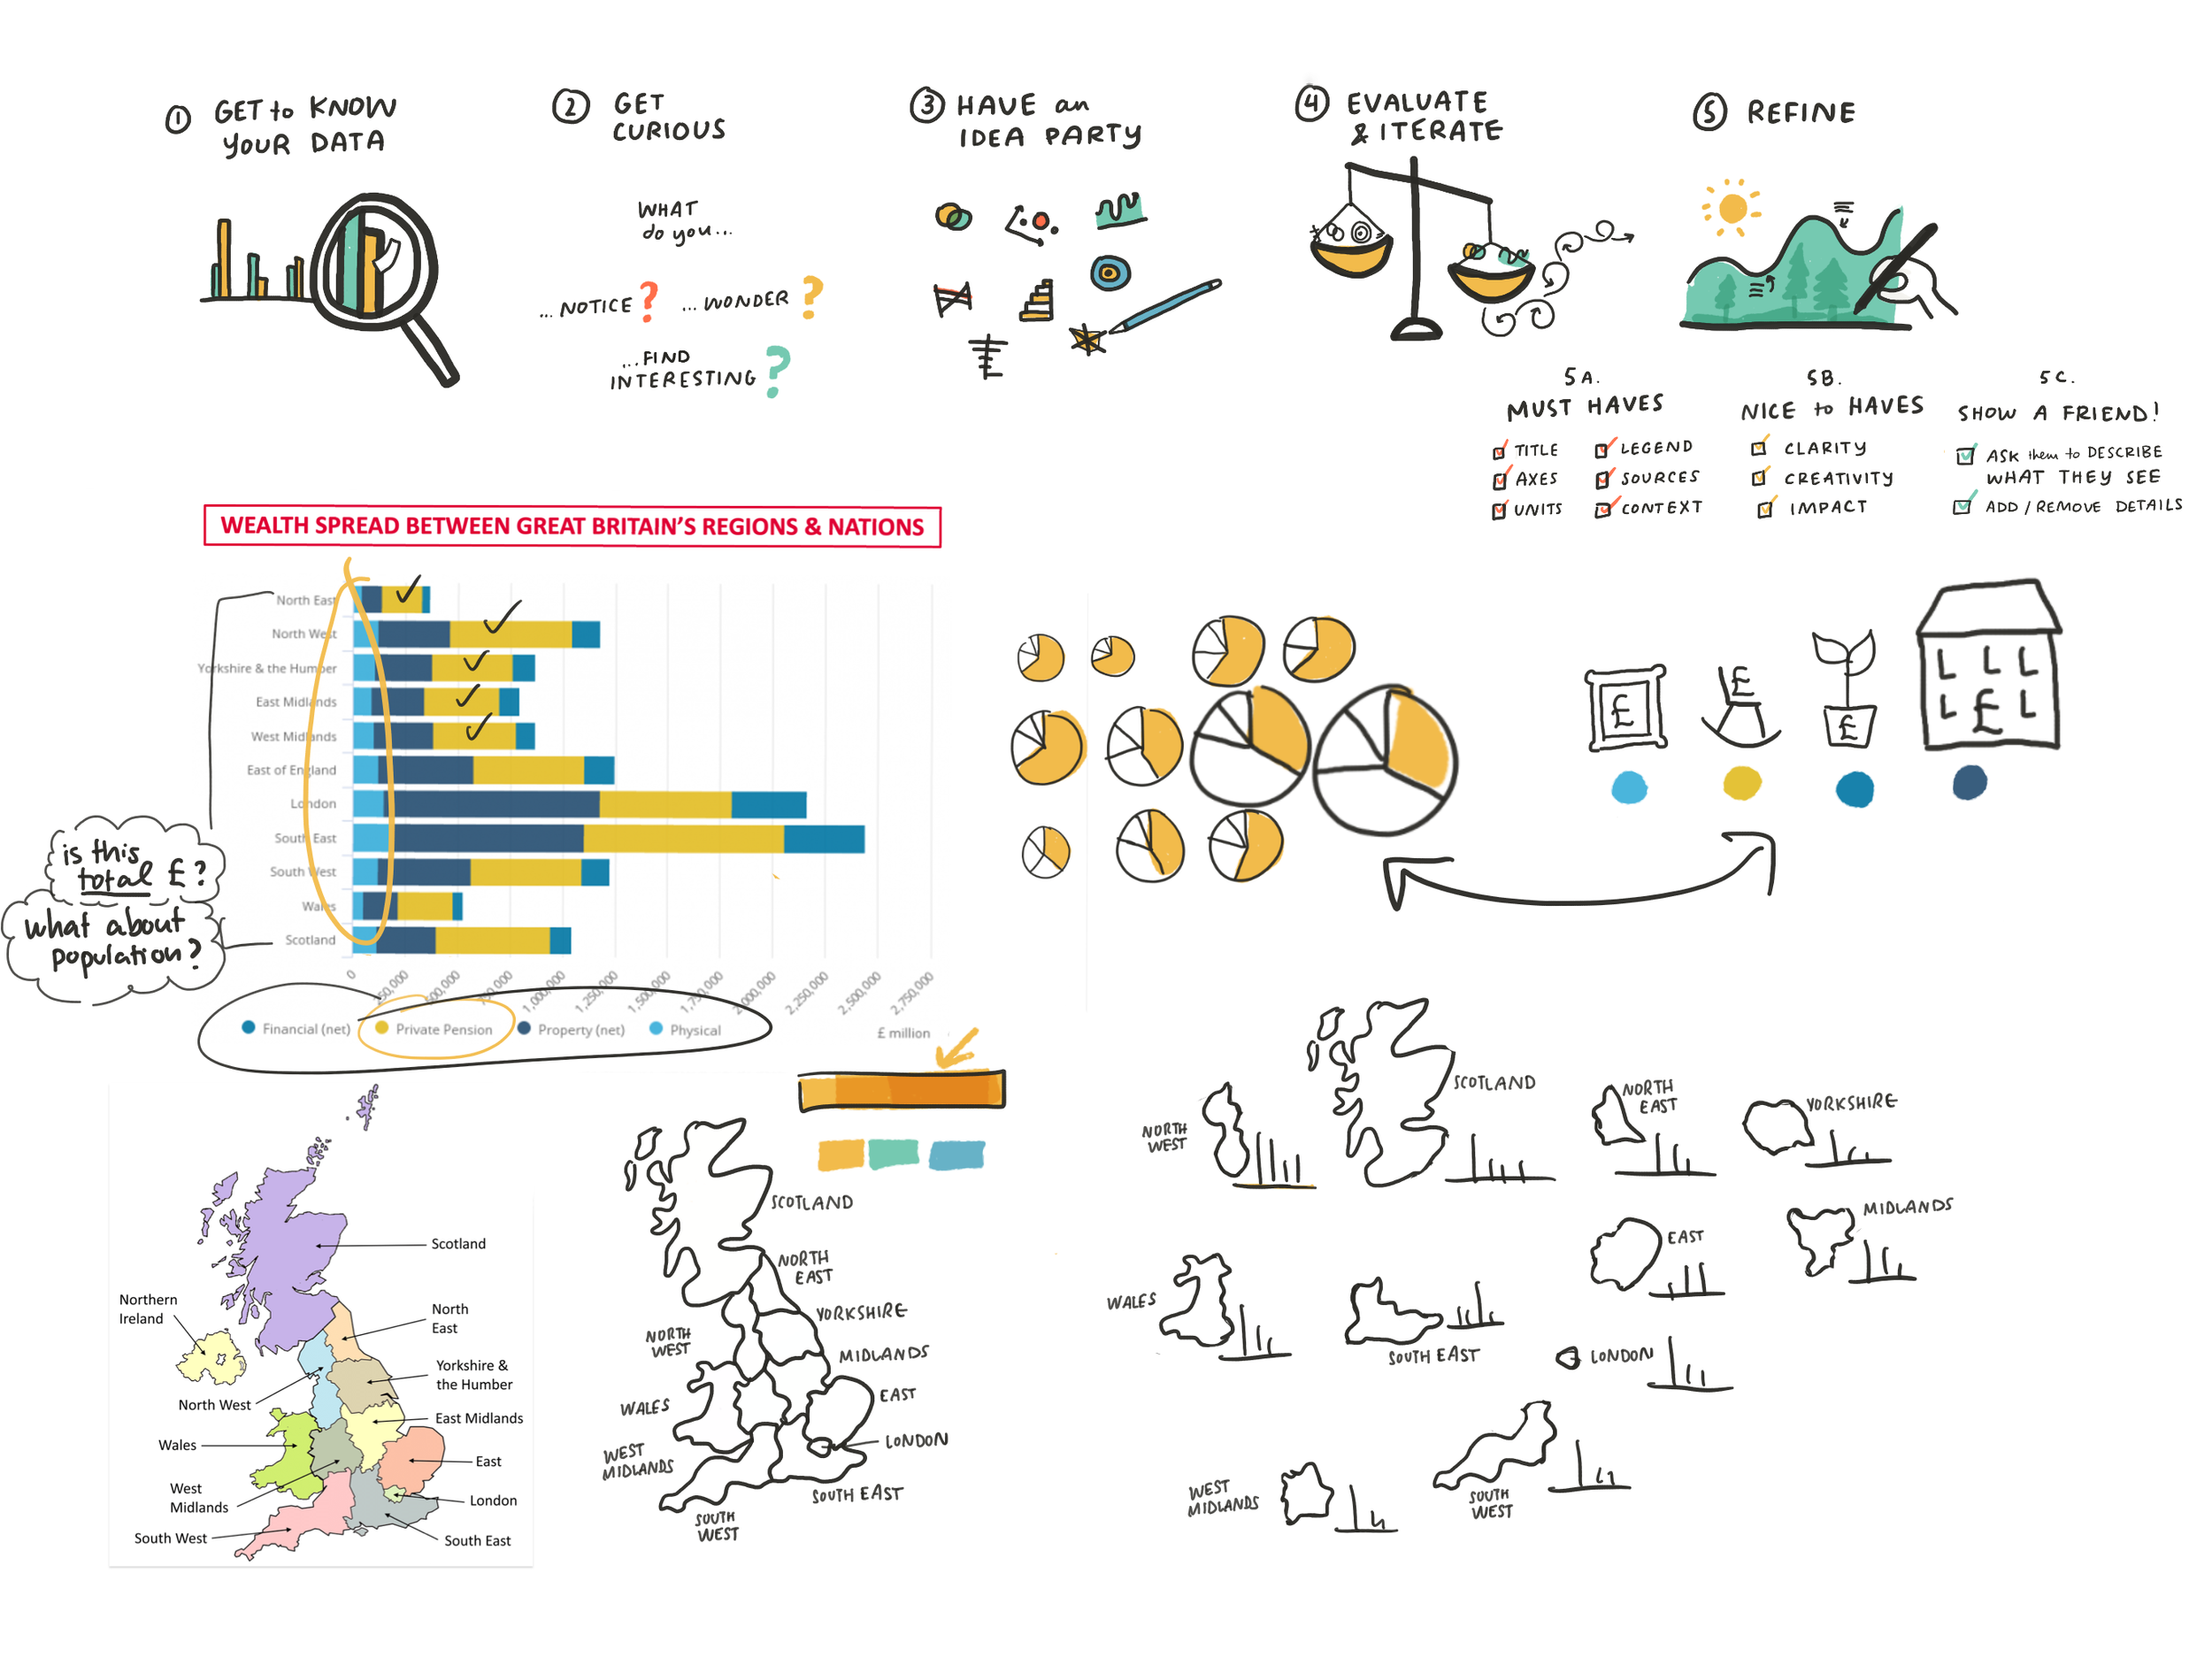
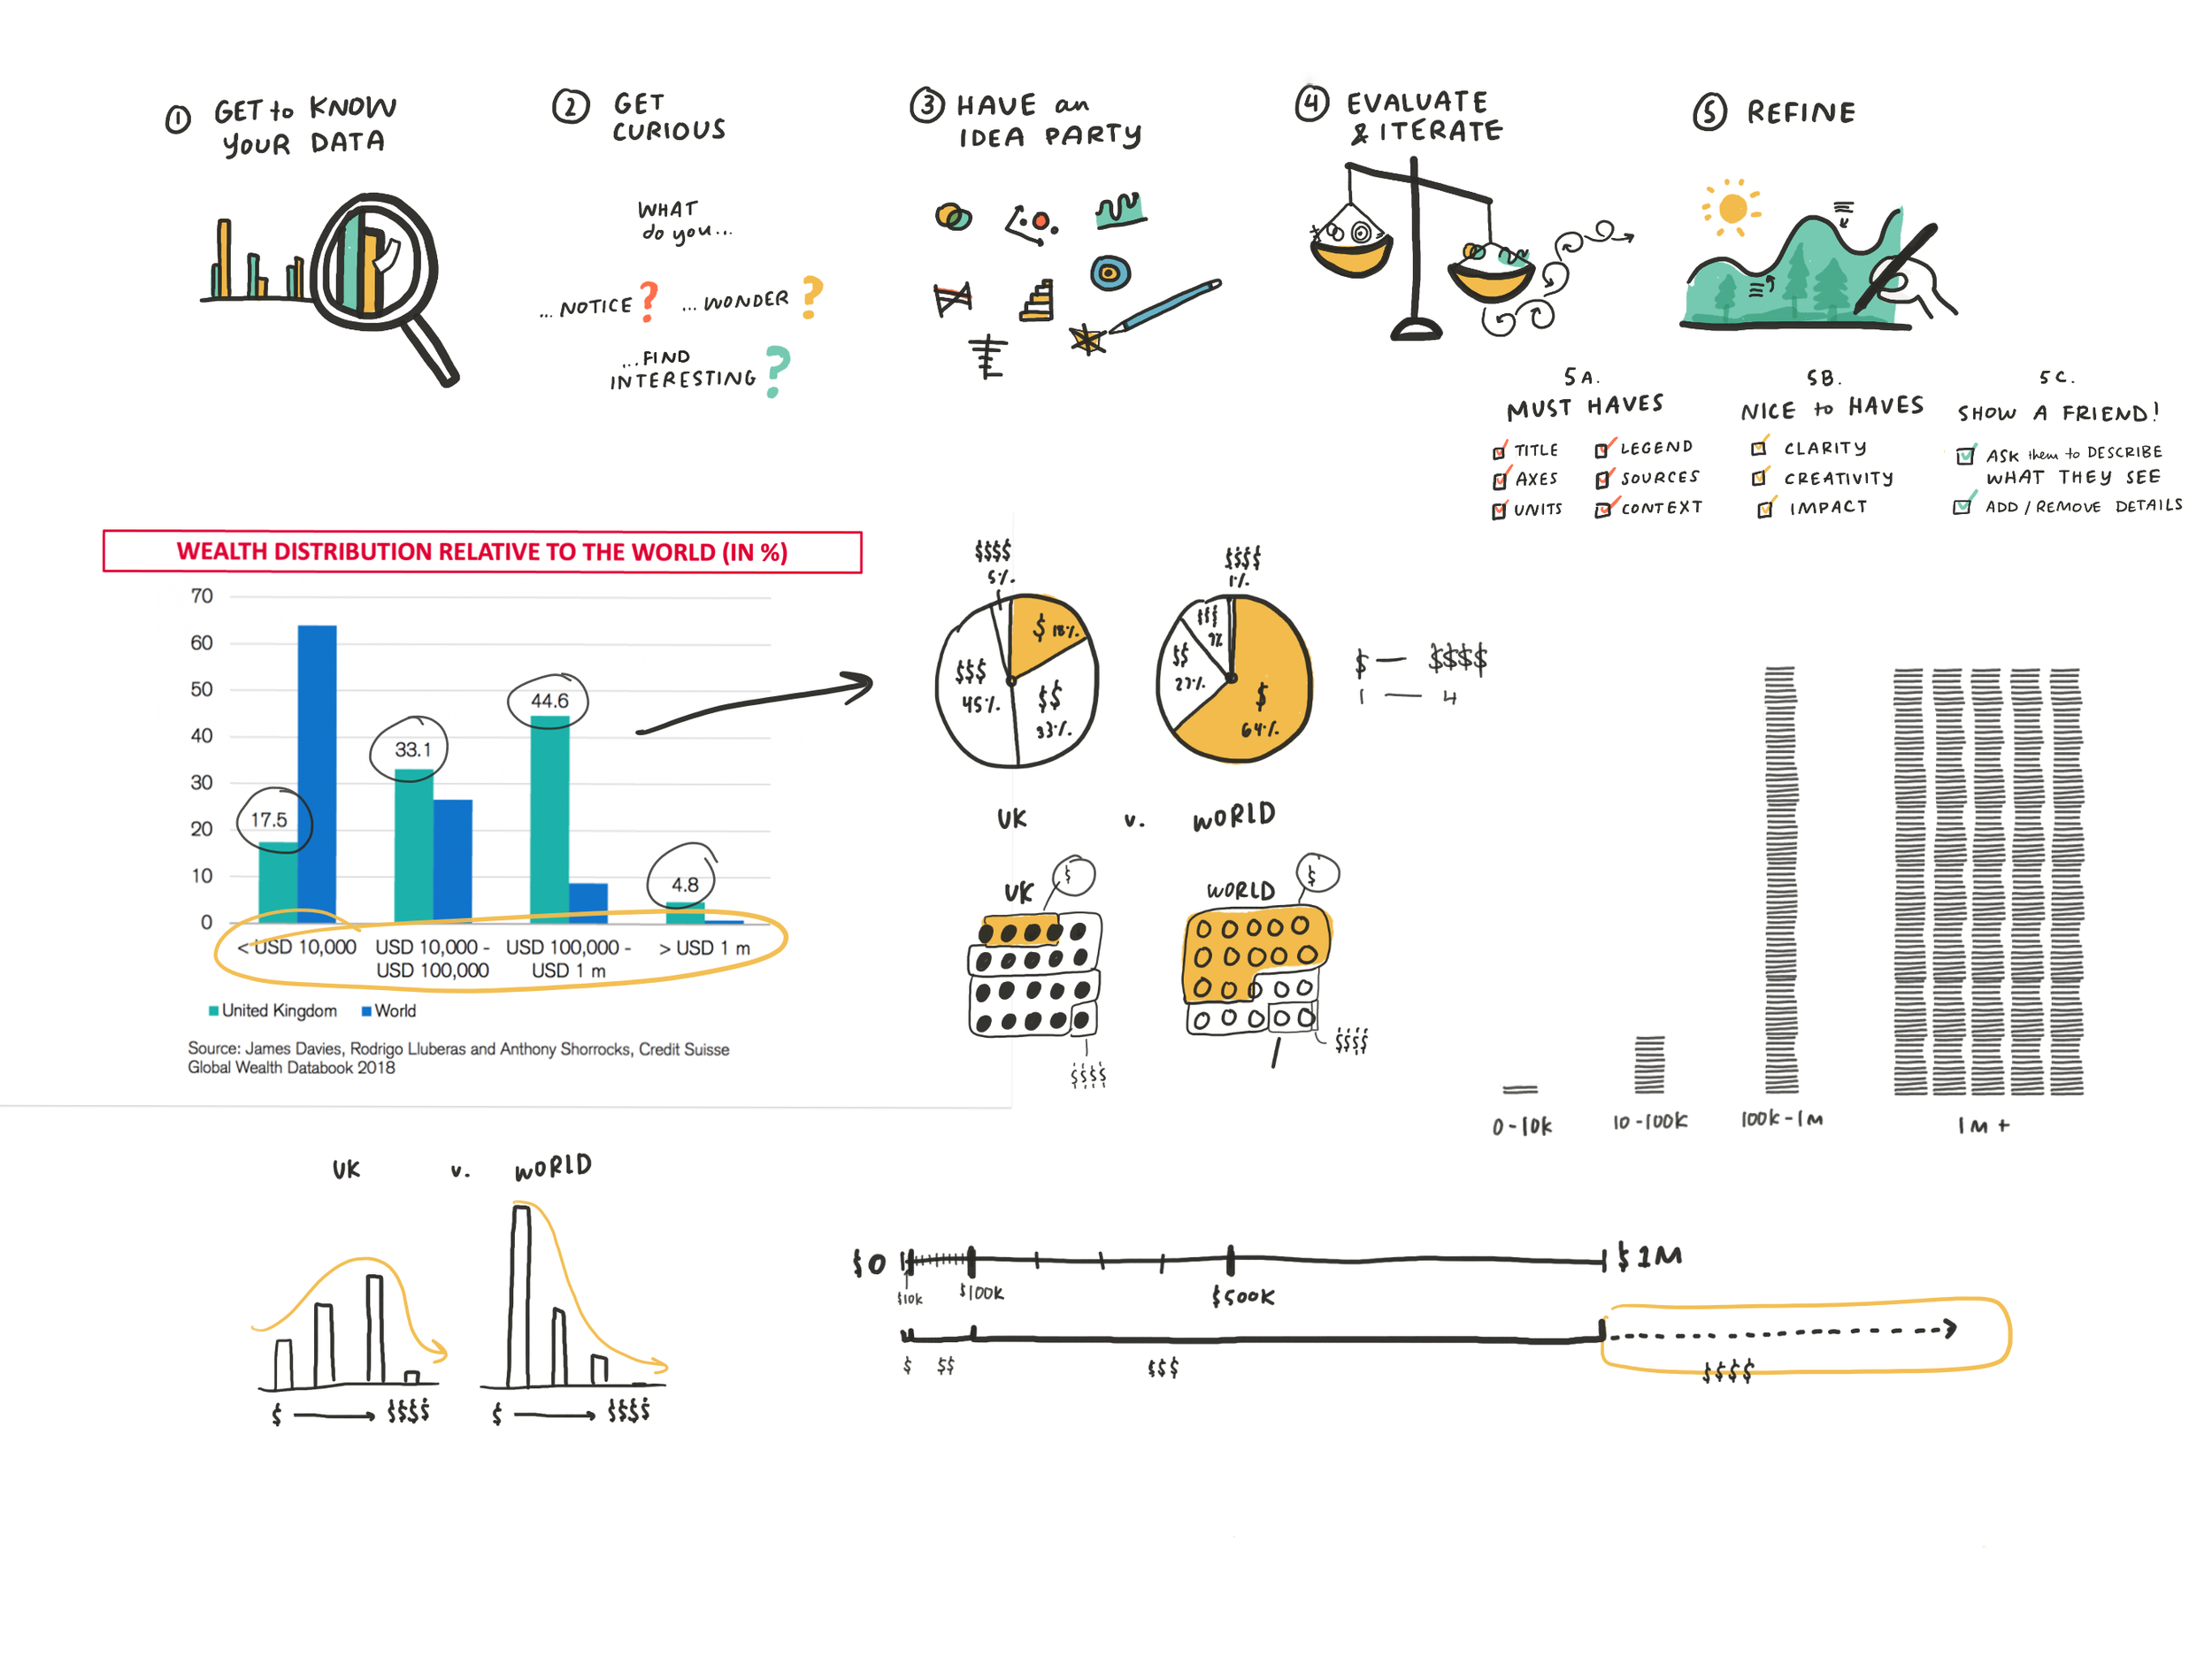
Design an easy to follow process to create a hand drawn data story
Tie the workshop content directly to the contest and introduce the makeover charts early
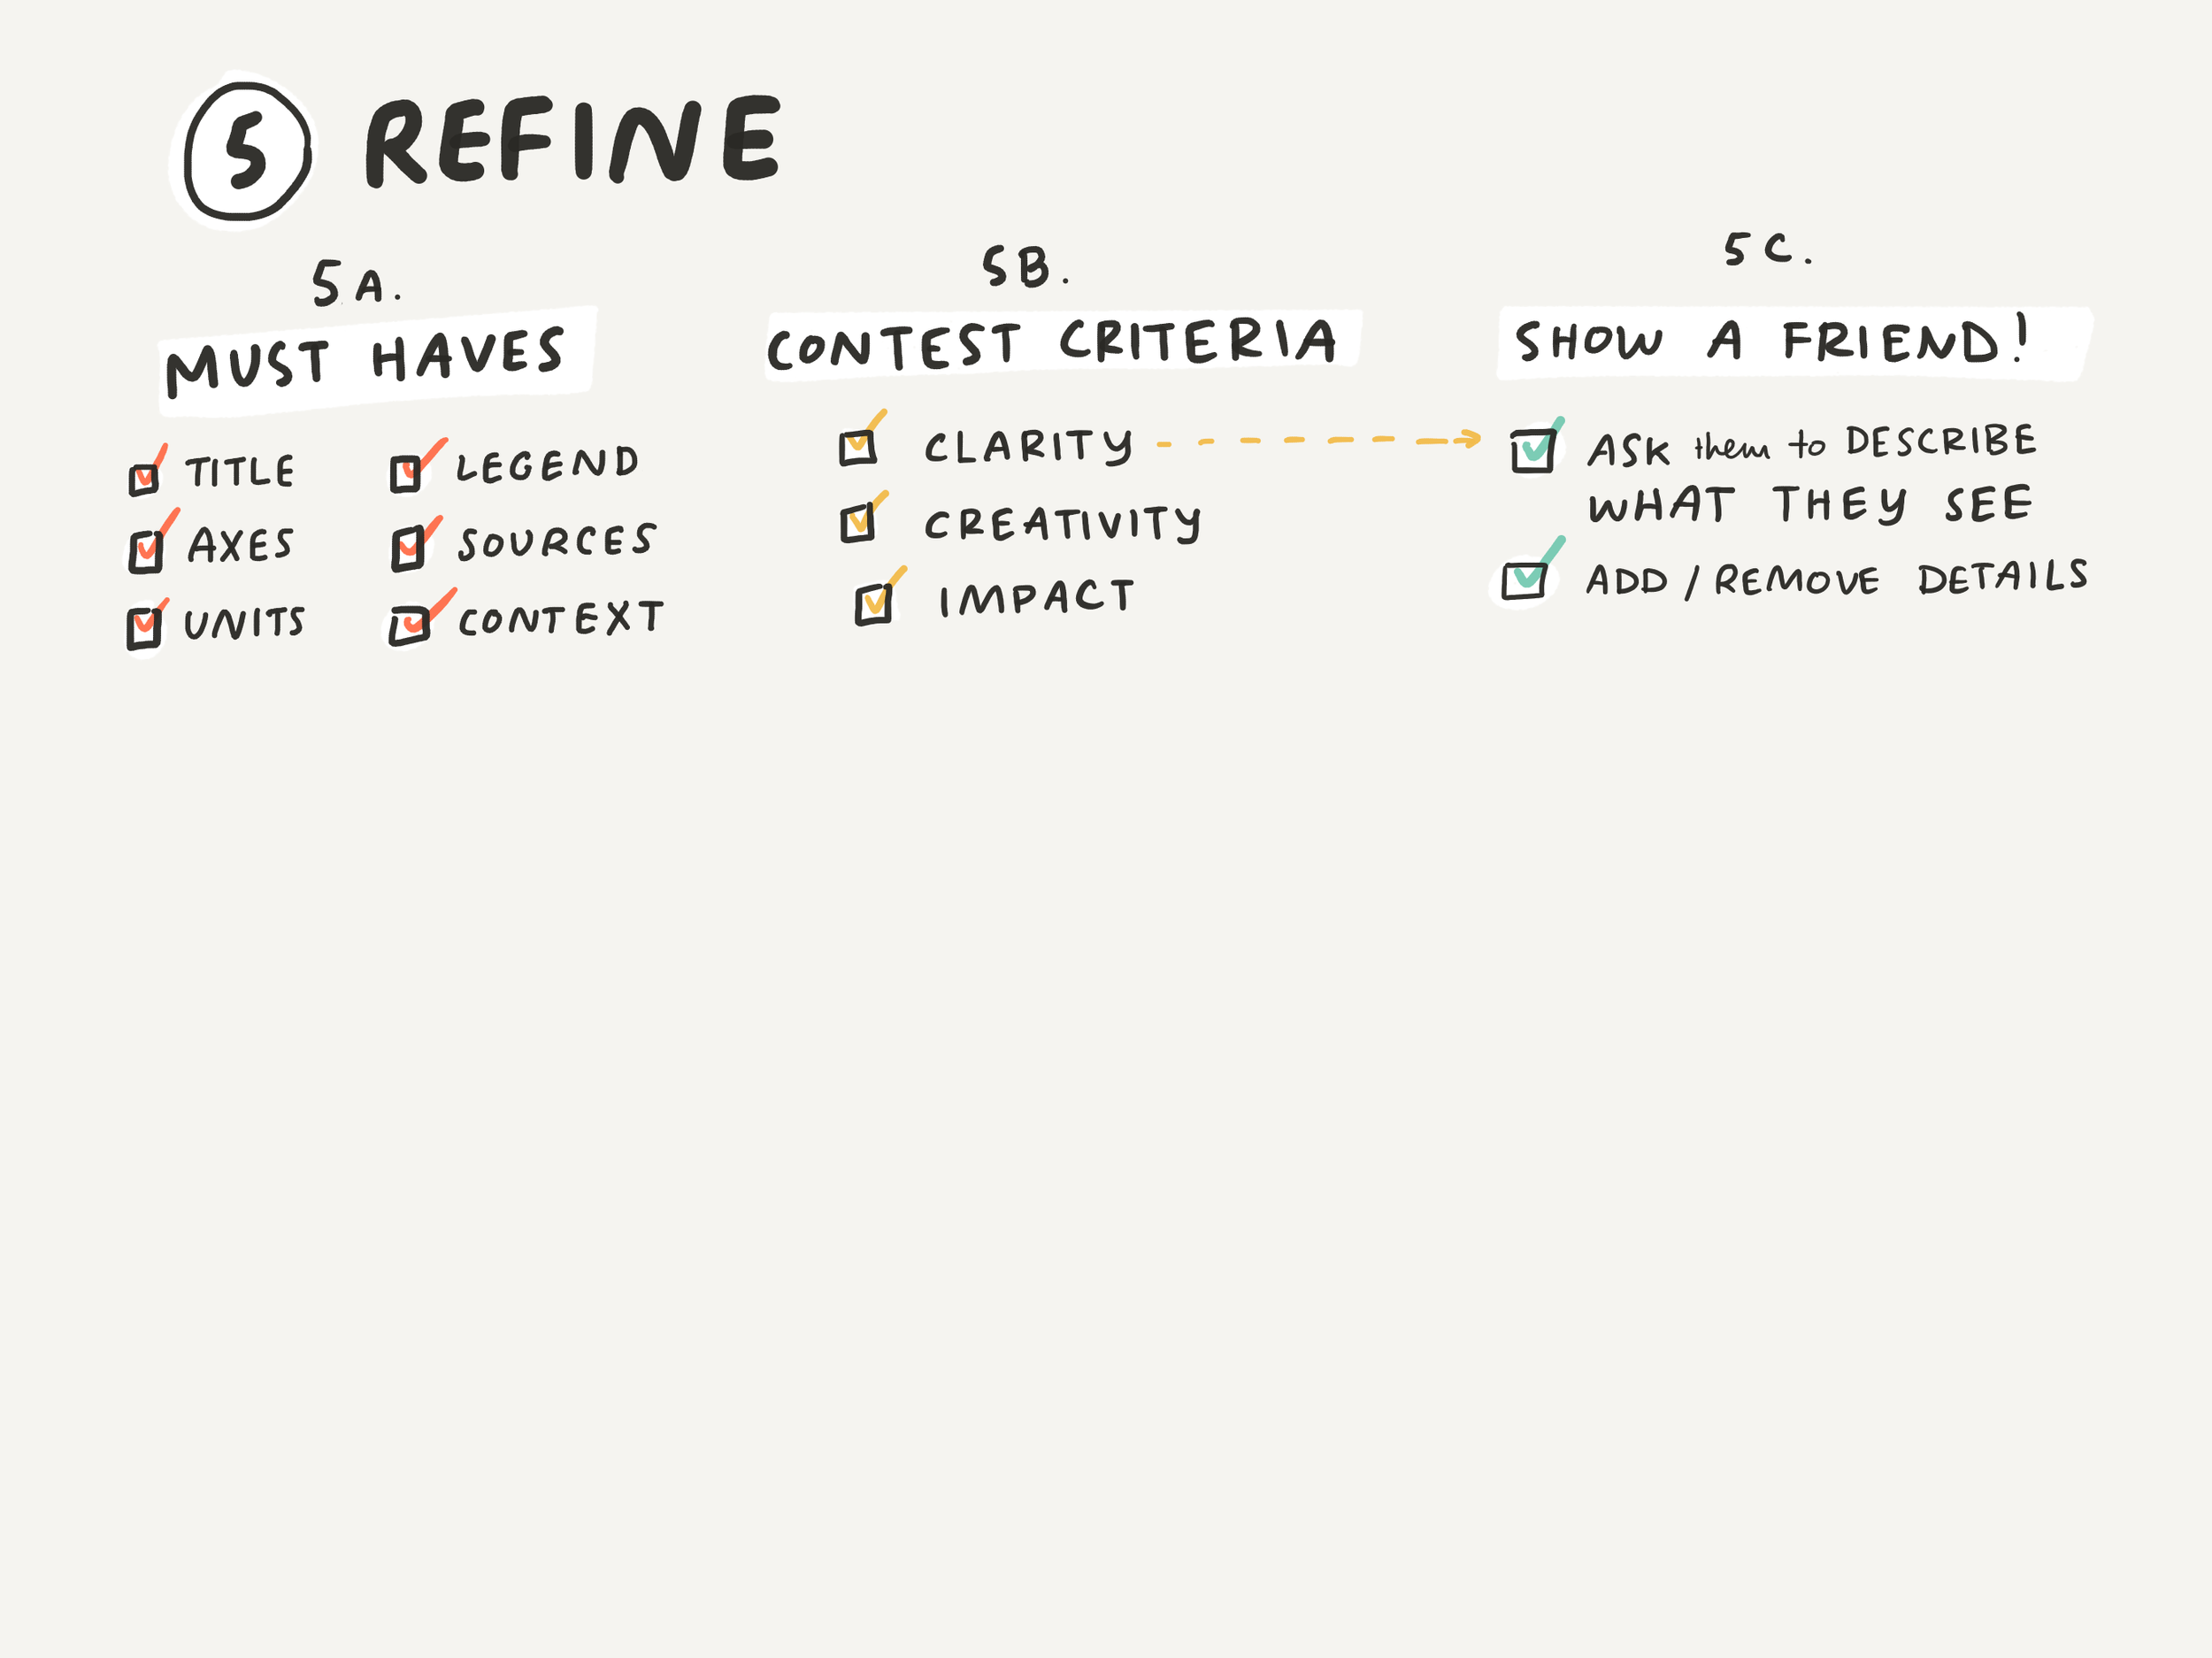
Create specific evaluation criteria and constraints for the contest participants (We ended up deciding to make it a chart makeover contest using a set of existing “traditional” visualizations)

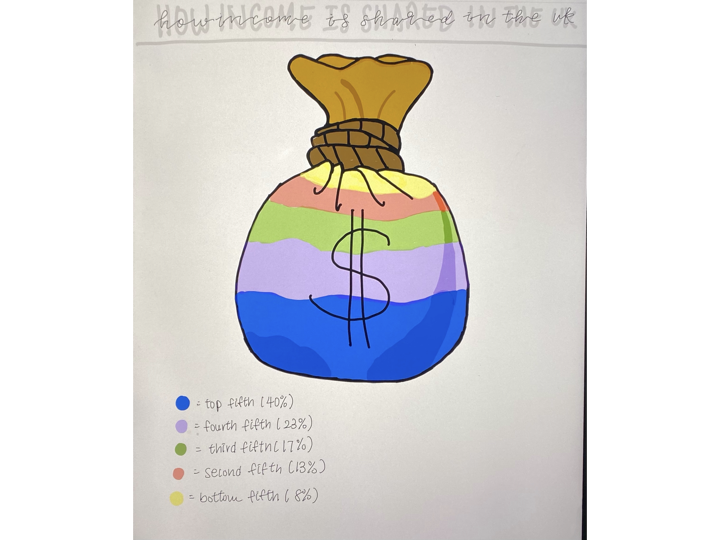
Selection of charts chosen to be Made-Over for the nationwide hand drawn data contest
How do we make sure that teachers remember the concepts and teach them effectively several months after taking the workshop?
Put together a thorough resources document and host on MEI website
Record videos demonstrating how the process applies to each of the contest visuals
How do we promote engagement during the webinar itself?
Build in lots of exercises and time to share in the agenda
Be specific and clear in our prompts; demonstrate as much as possible
Use language that is approachable for adults who may feel intimidated to draw and share their creationsT
The synthesis of my instructional design process is best summarized in the screen shot below, the high level overview page of my detailed facilitator guide google doc. We start with goals and logistics, understand the audience, and then map out a high level game plan for the allotted time.
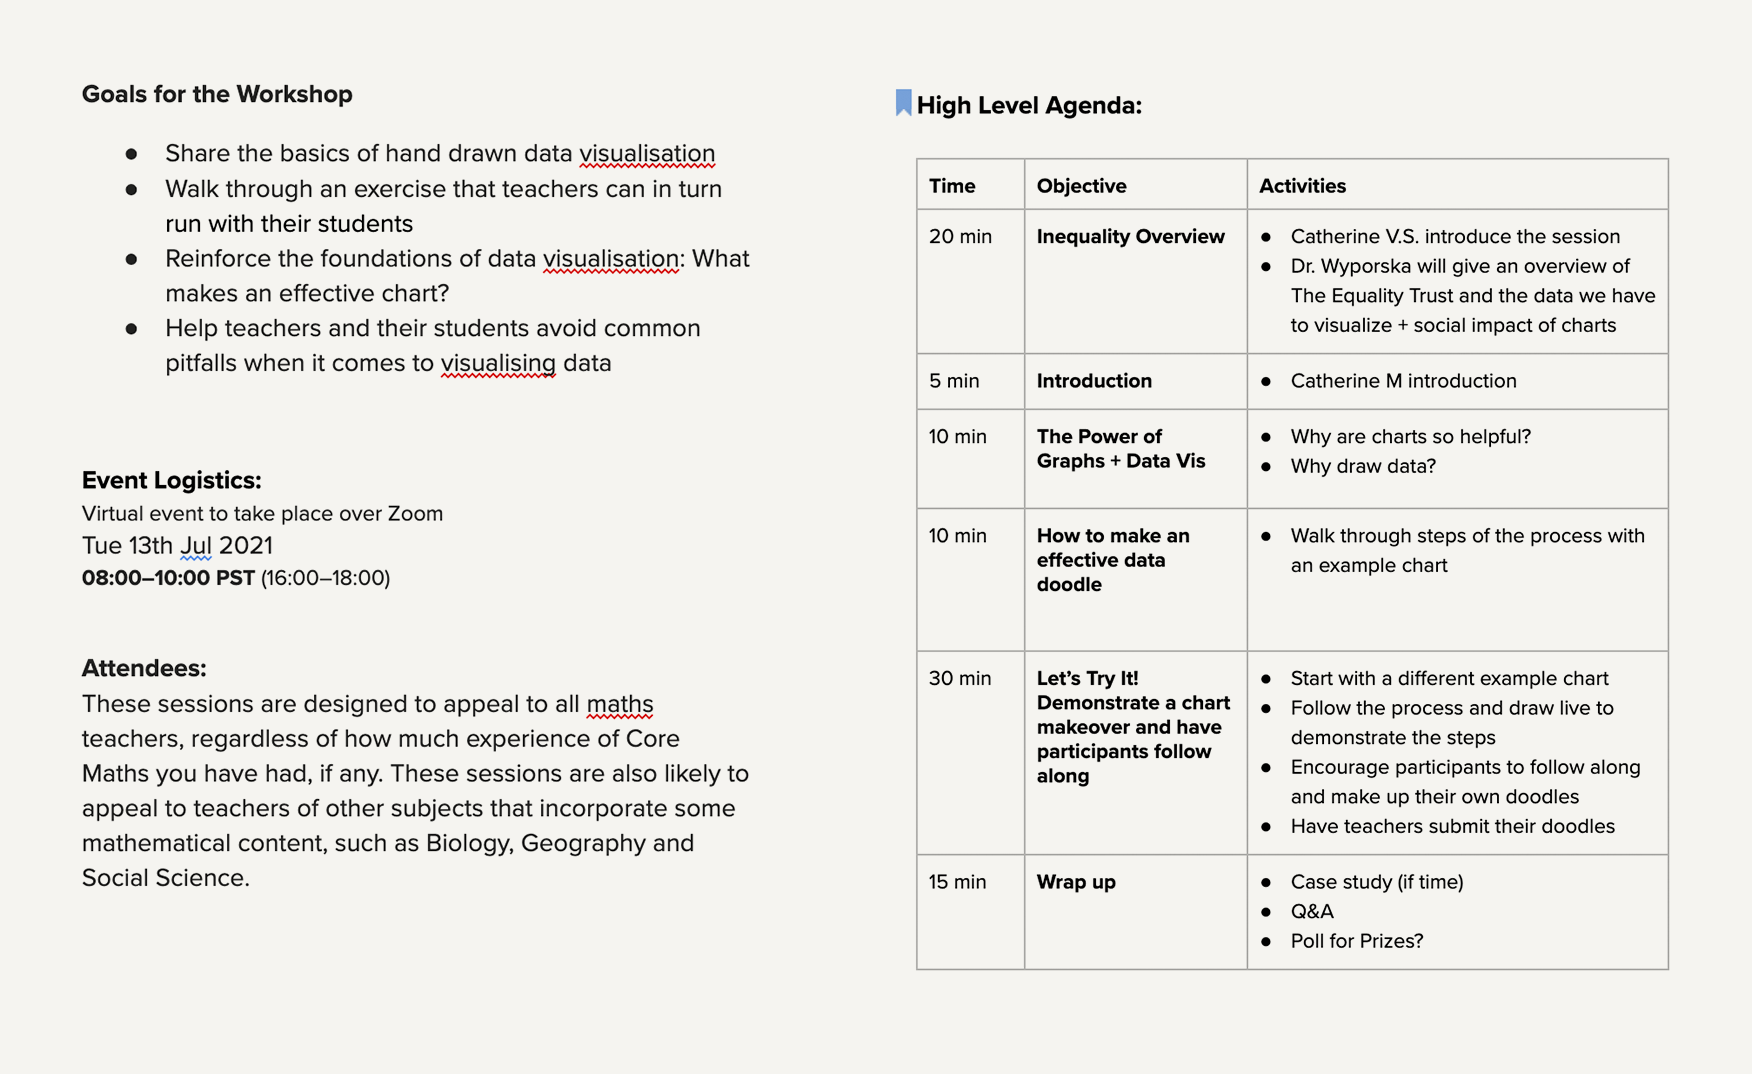
Page one of every workshop design document includes a high level overview that molds the shape of a more detailed agenda
Webinar / WOrkshop Delivery

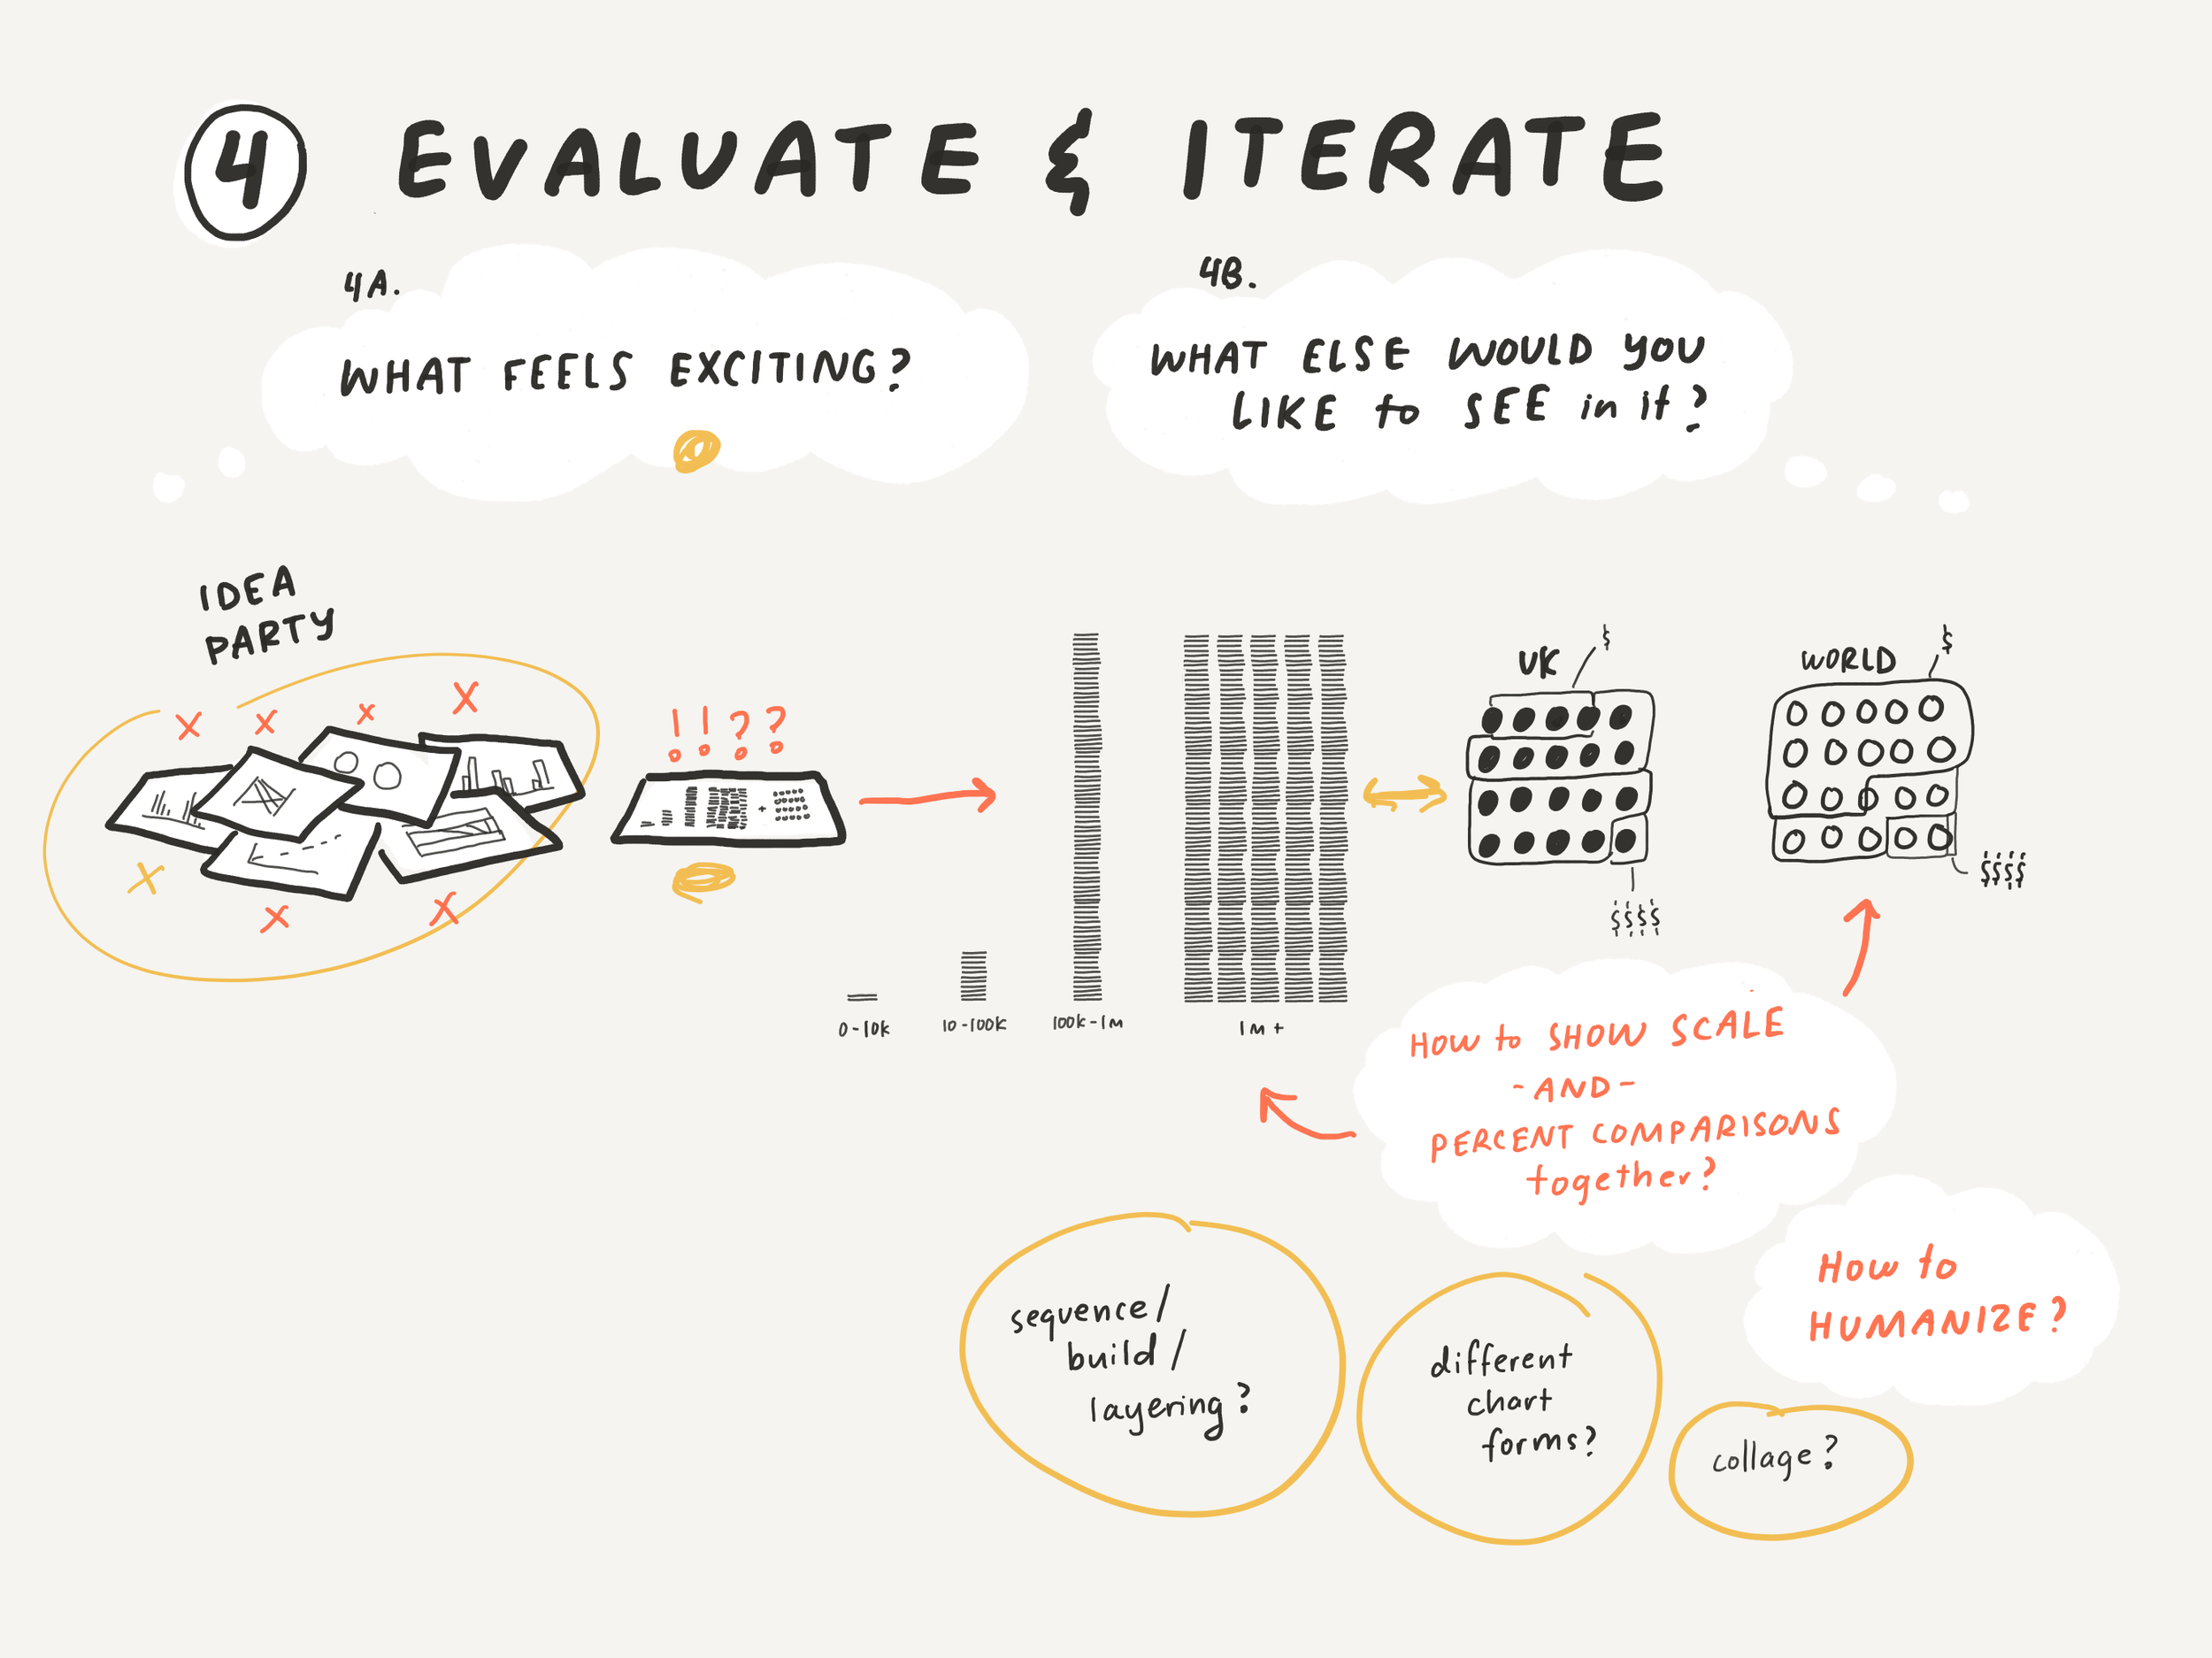
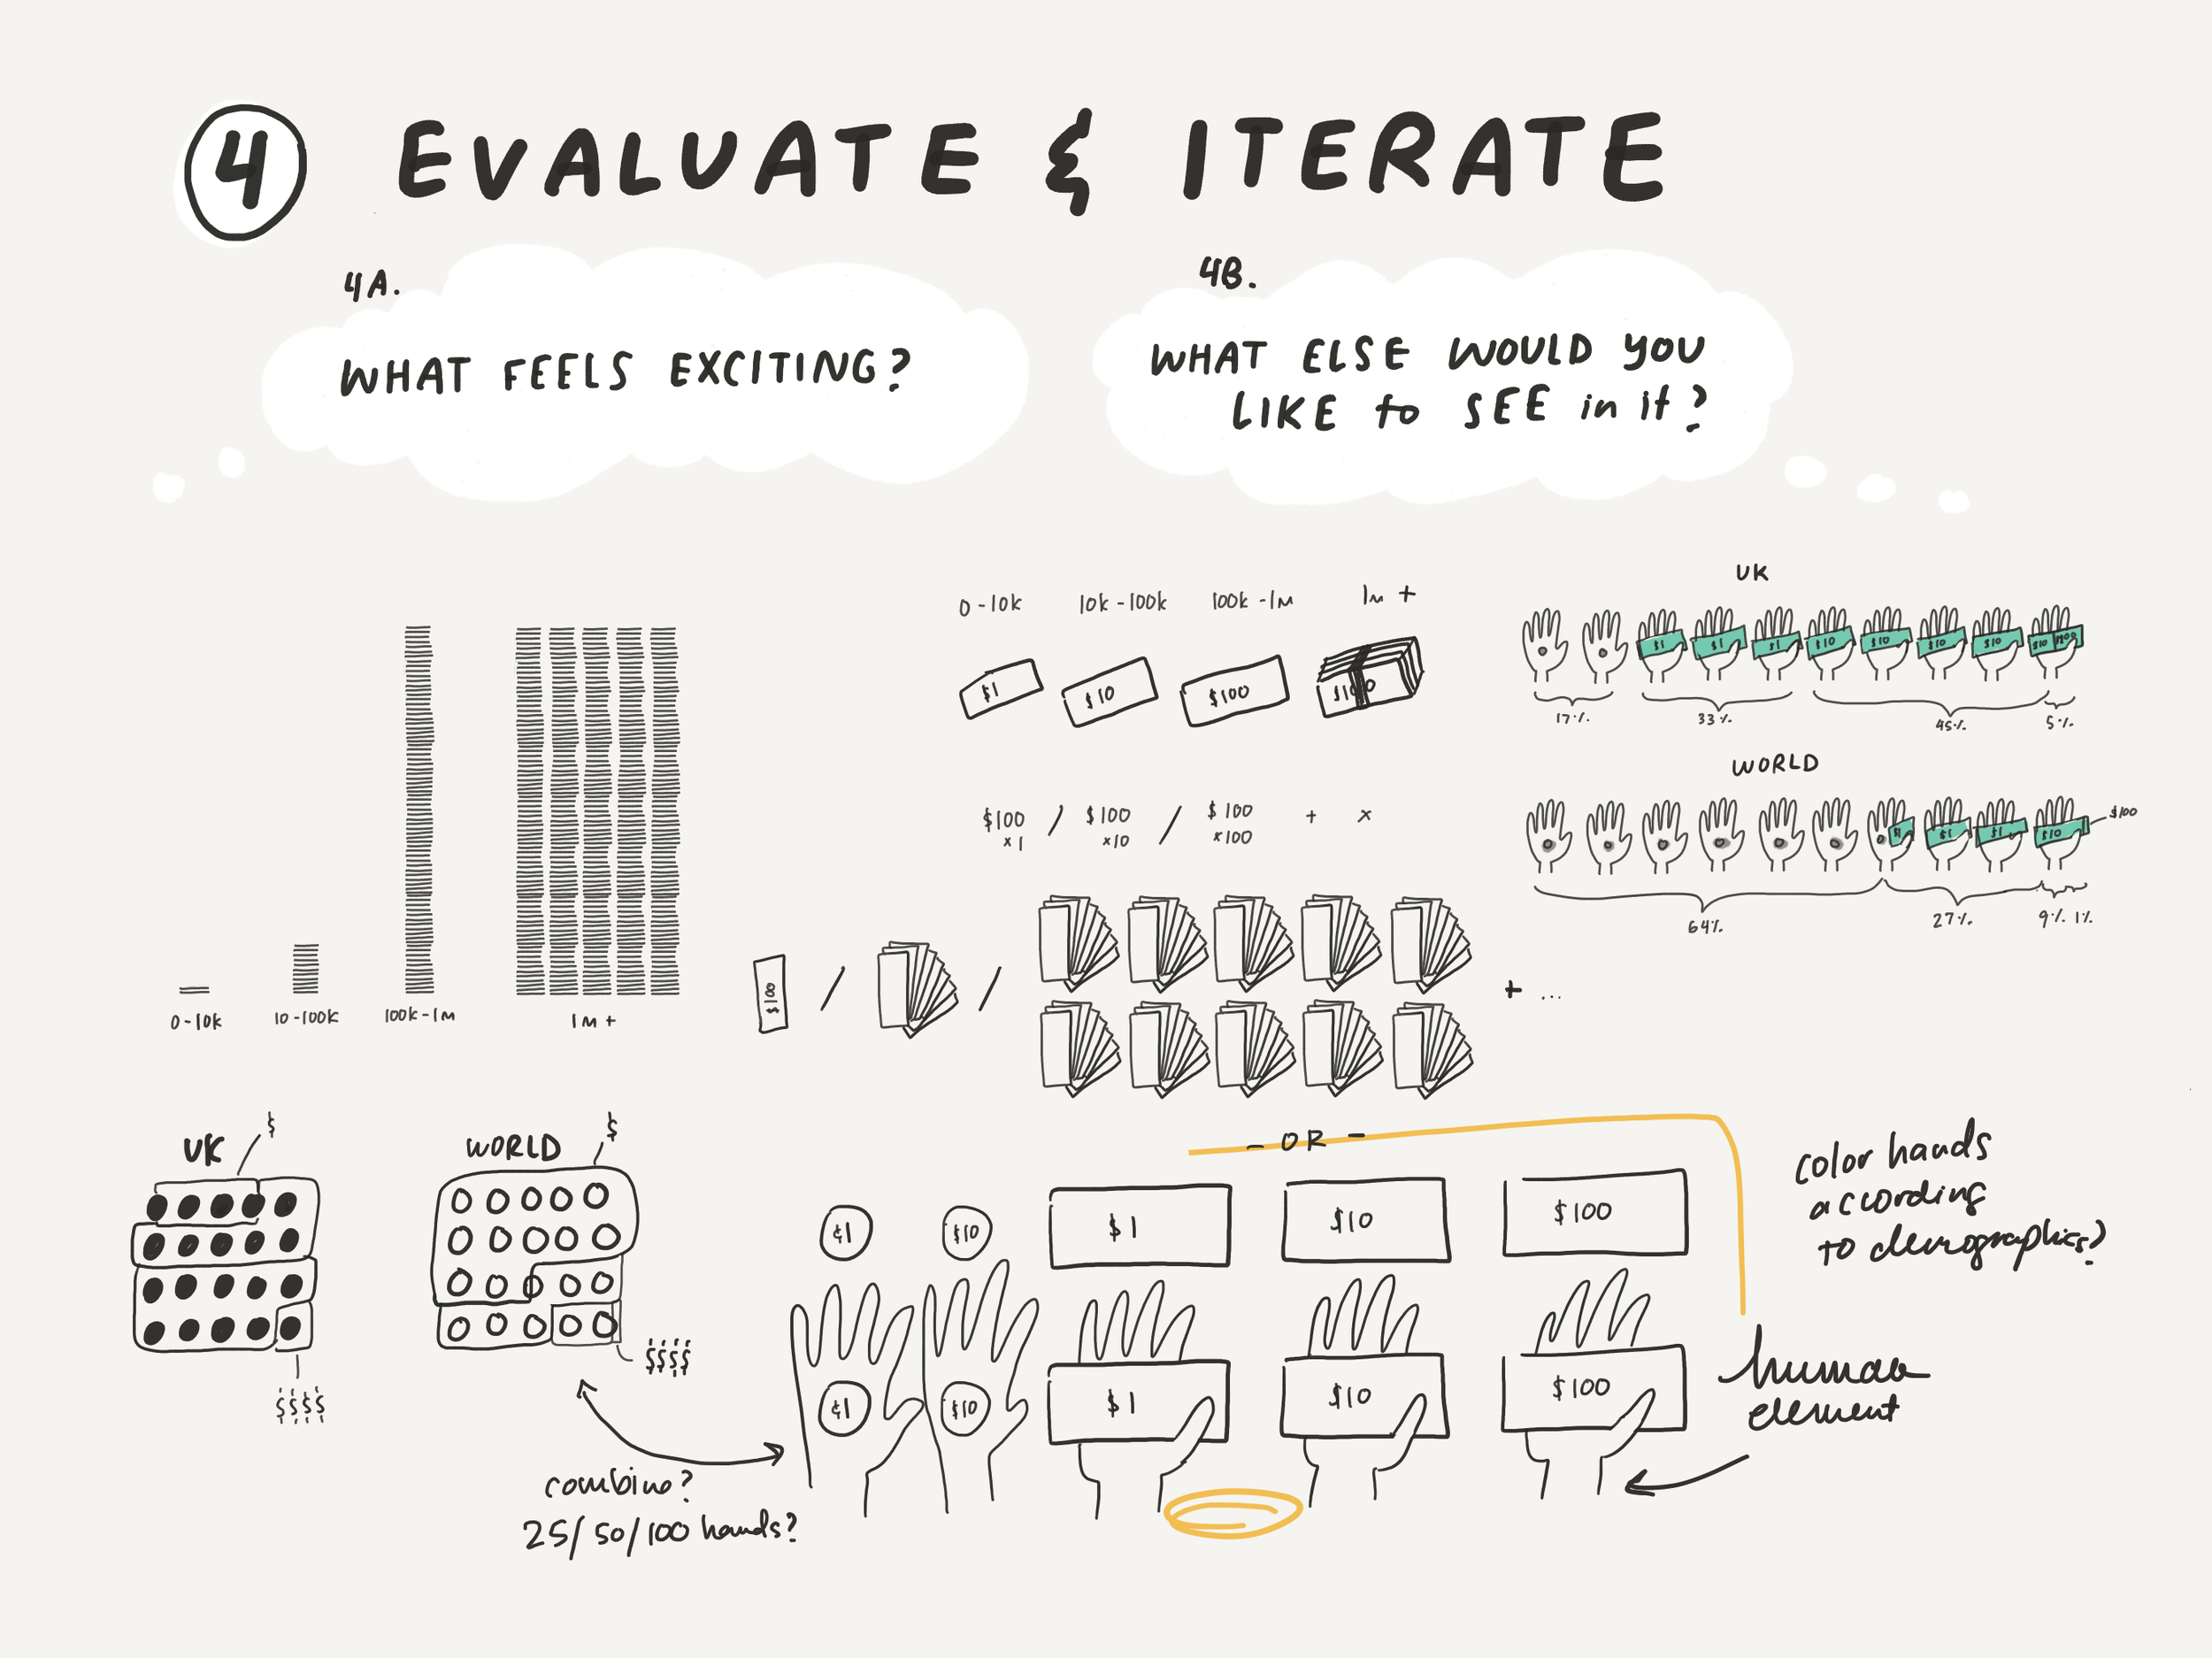
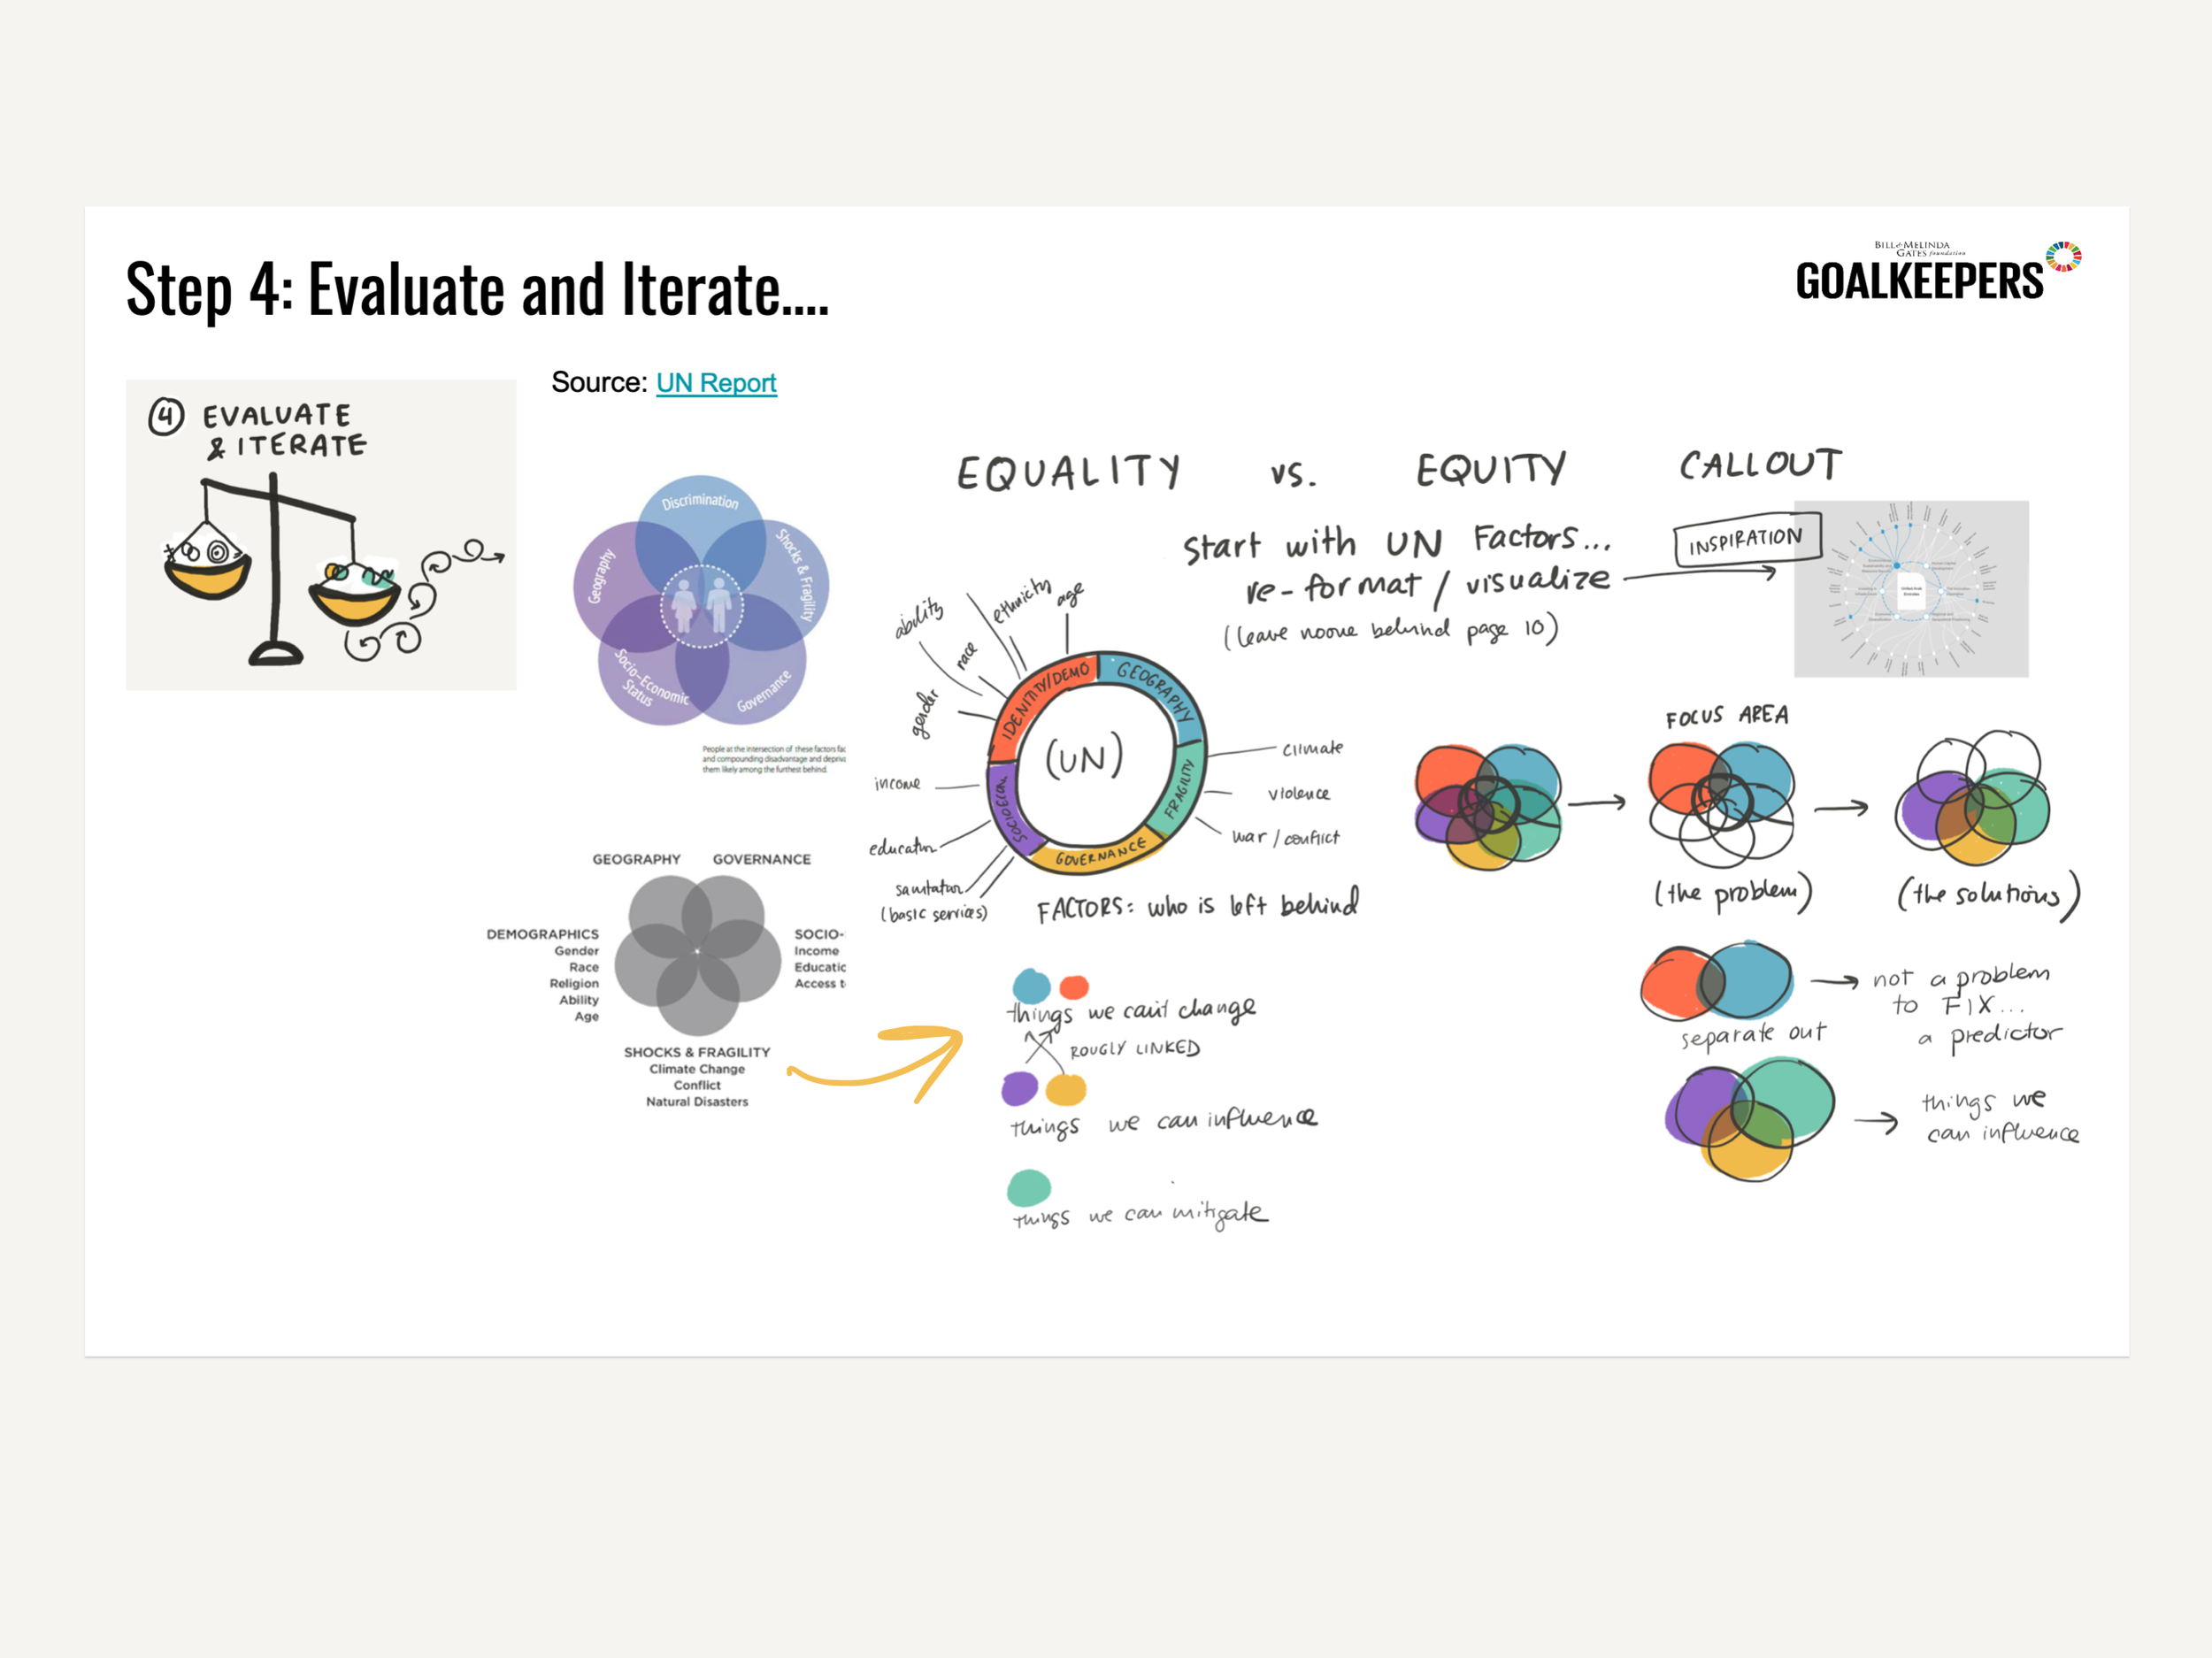
spotlighting a participant who shared the insights they gleaned from the iterative process I guided them through
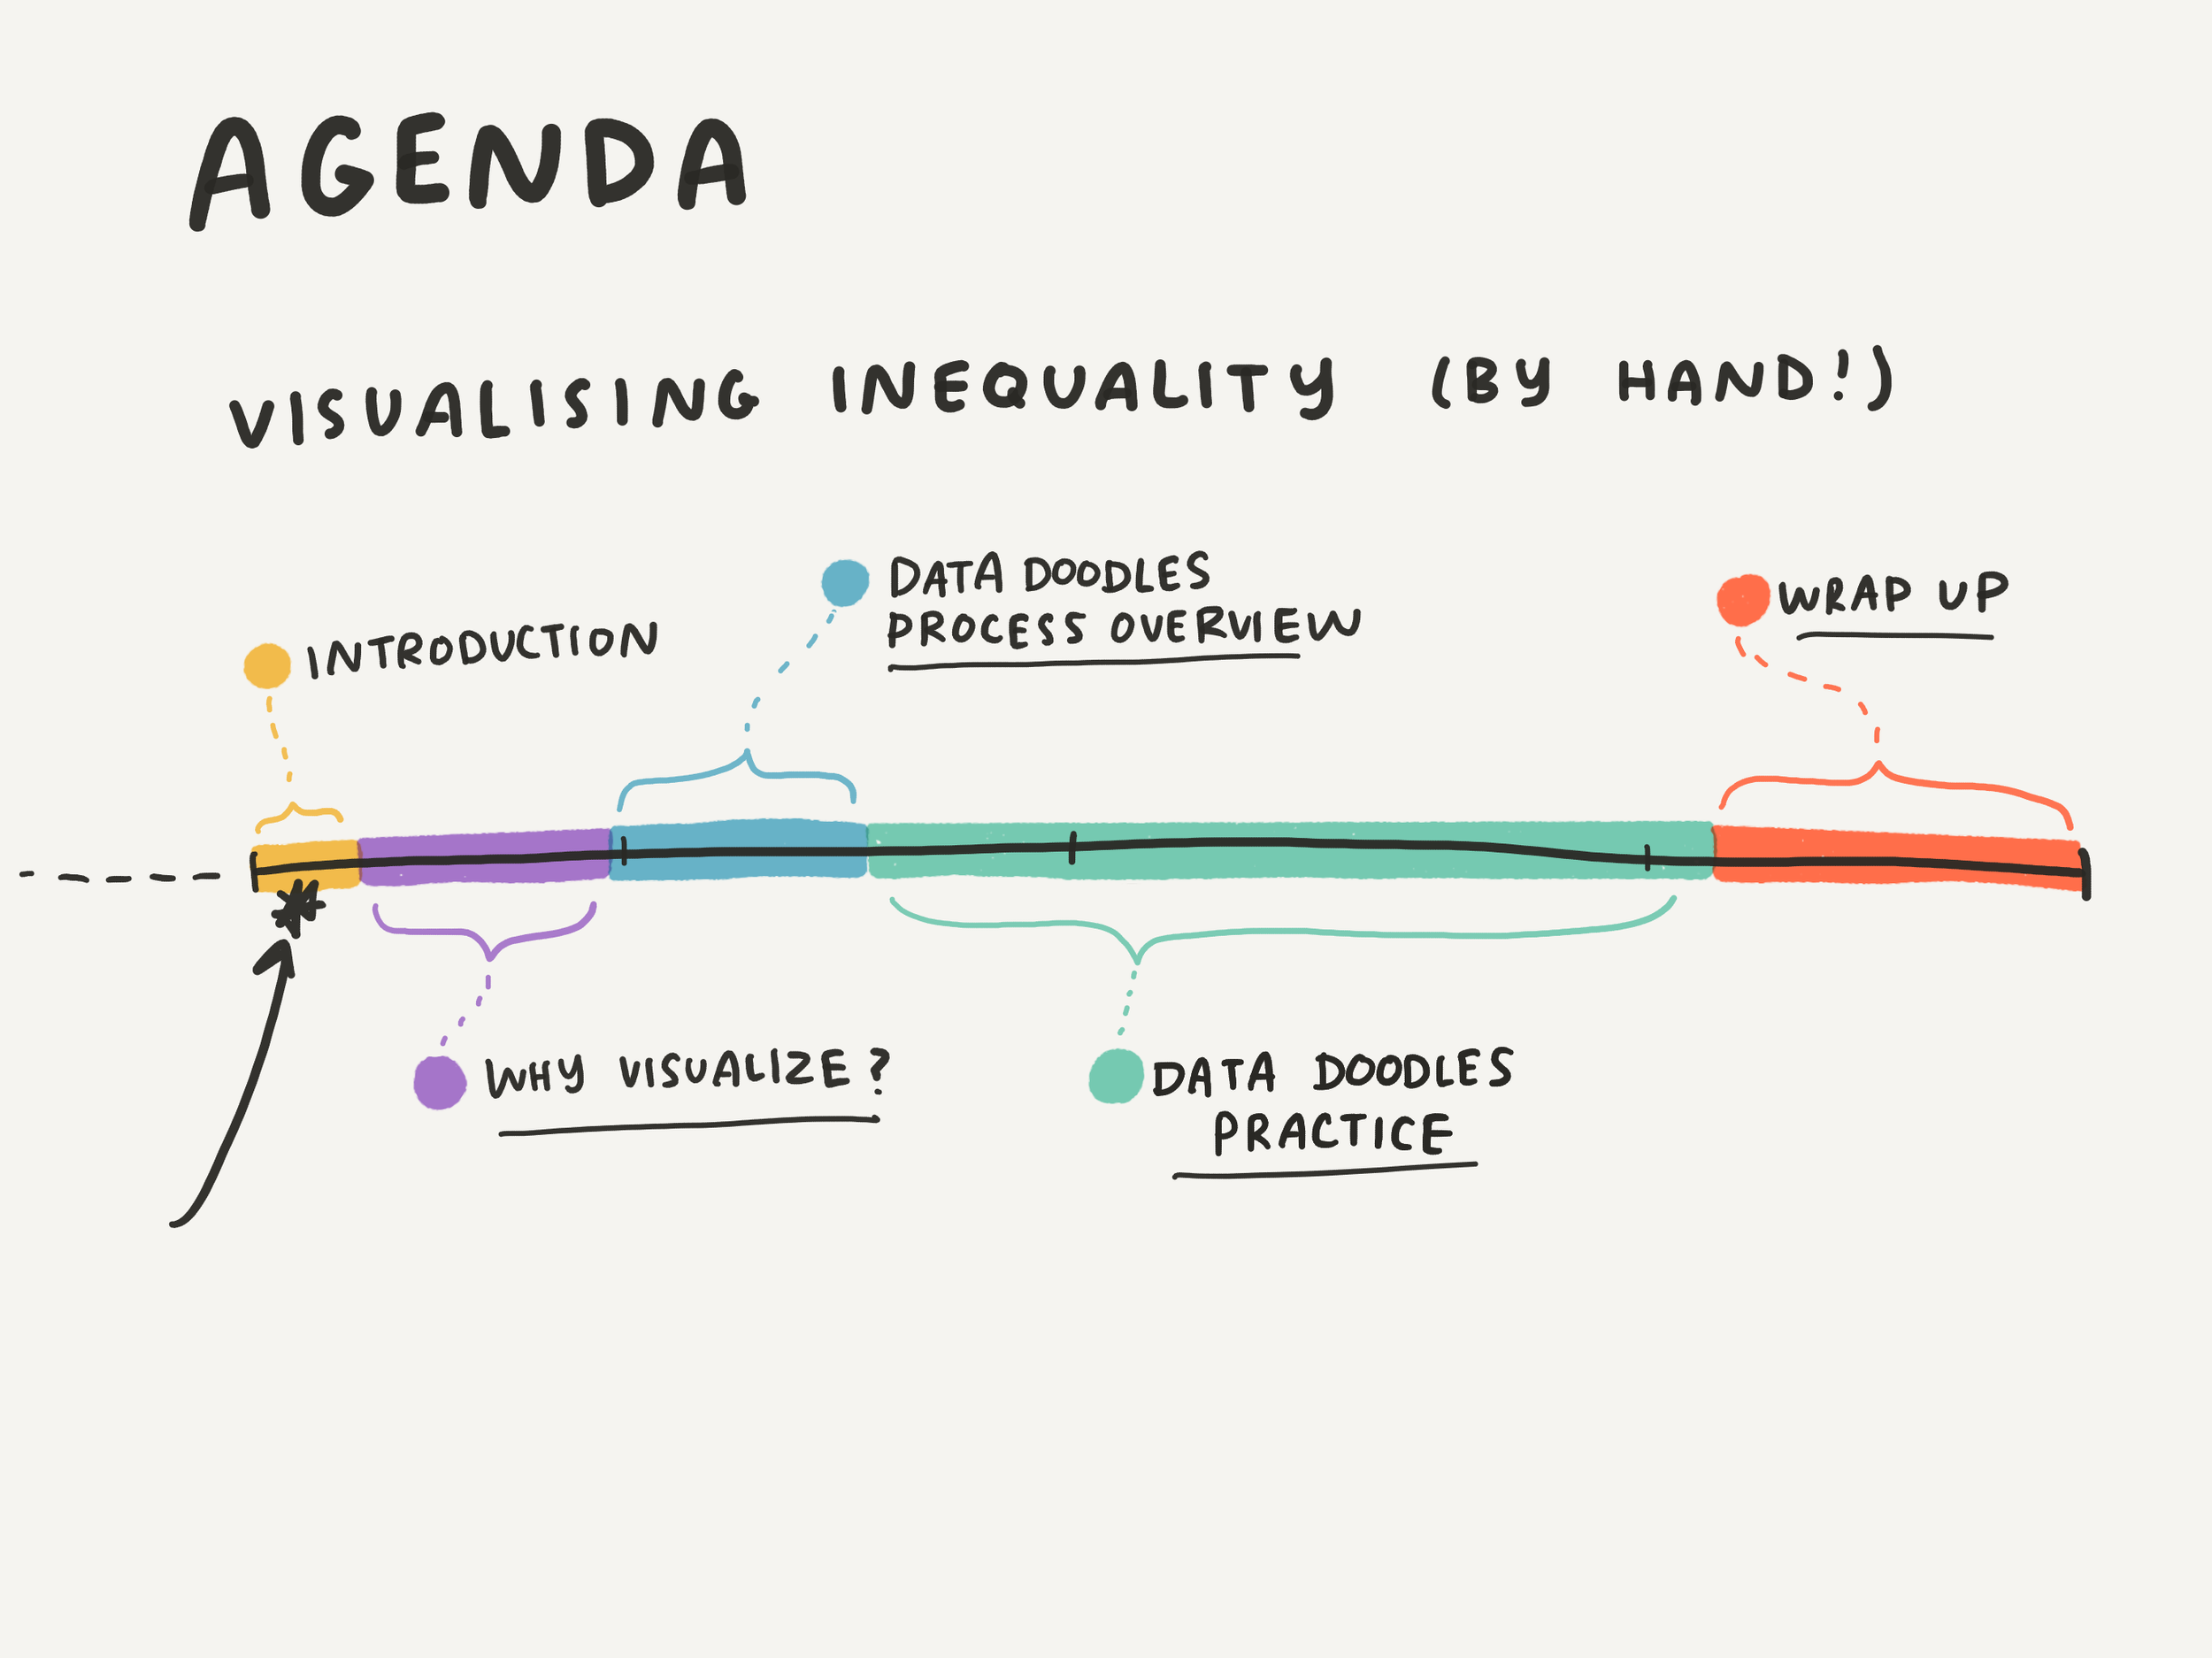
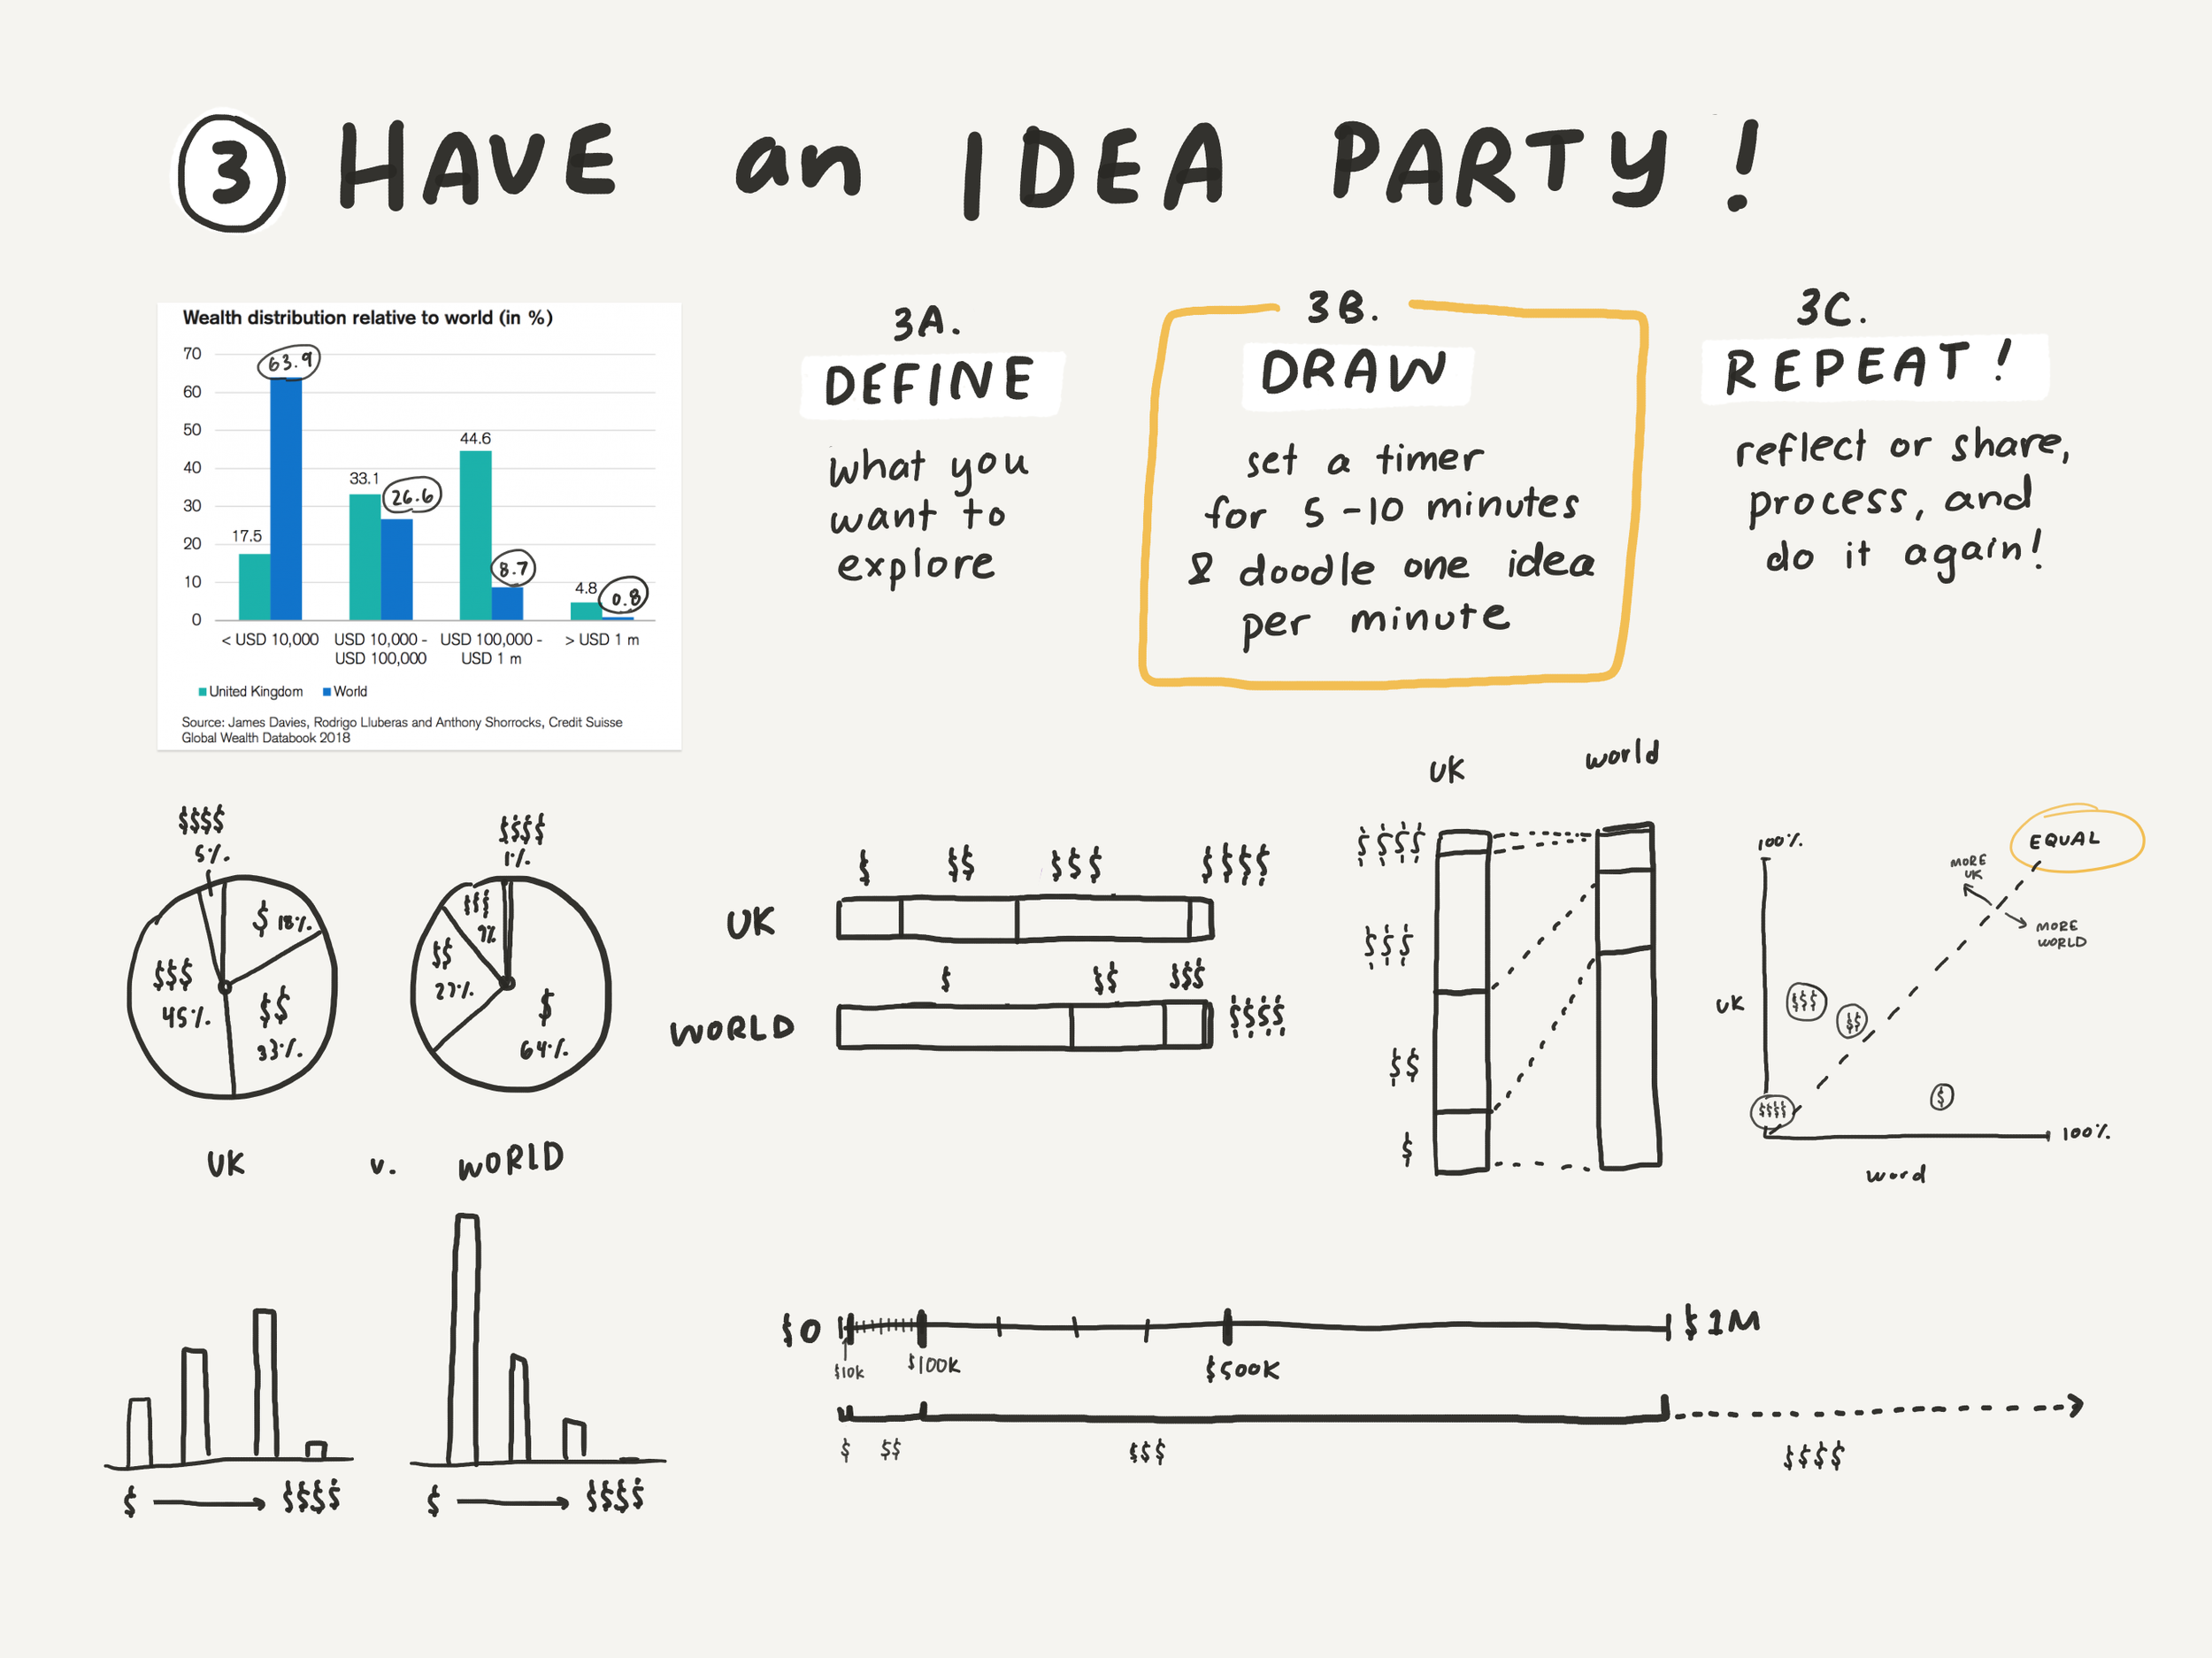
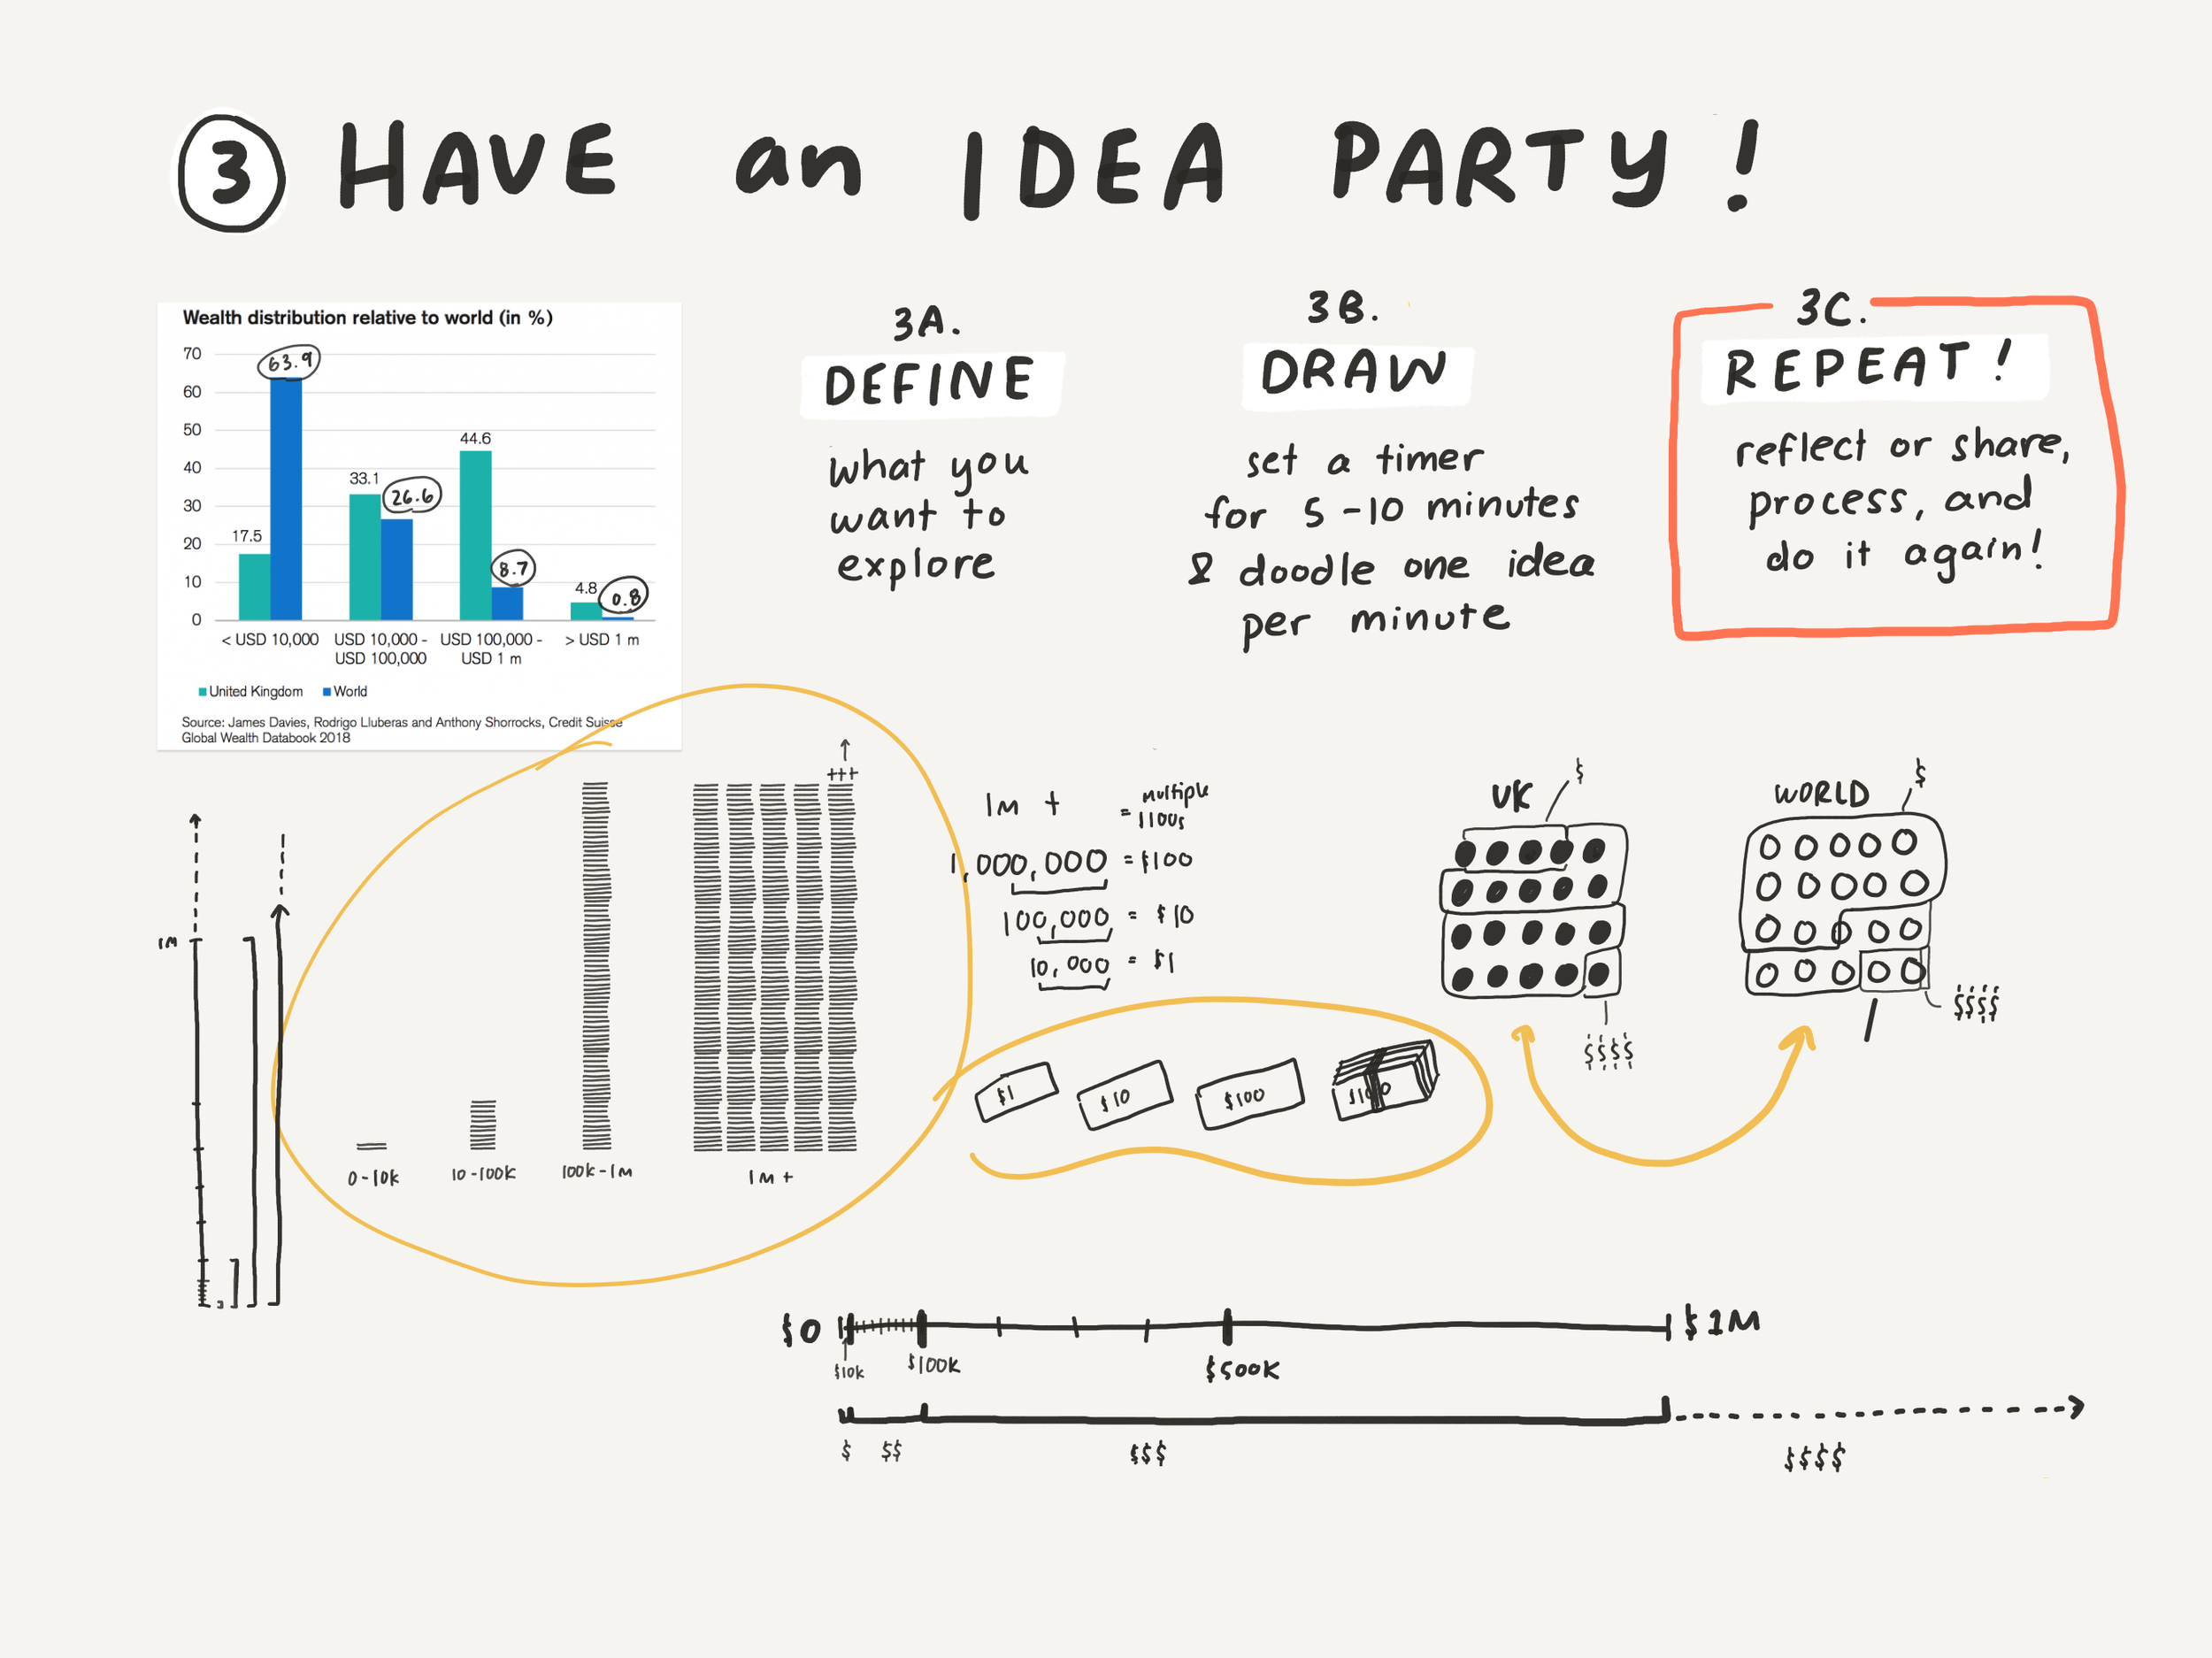
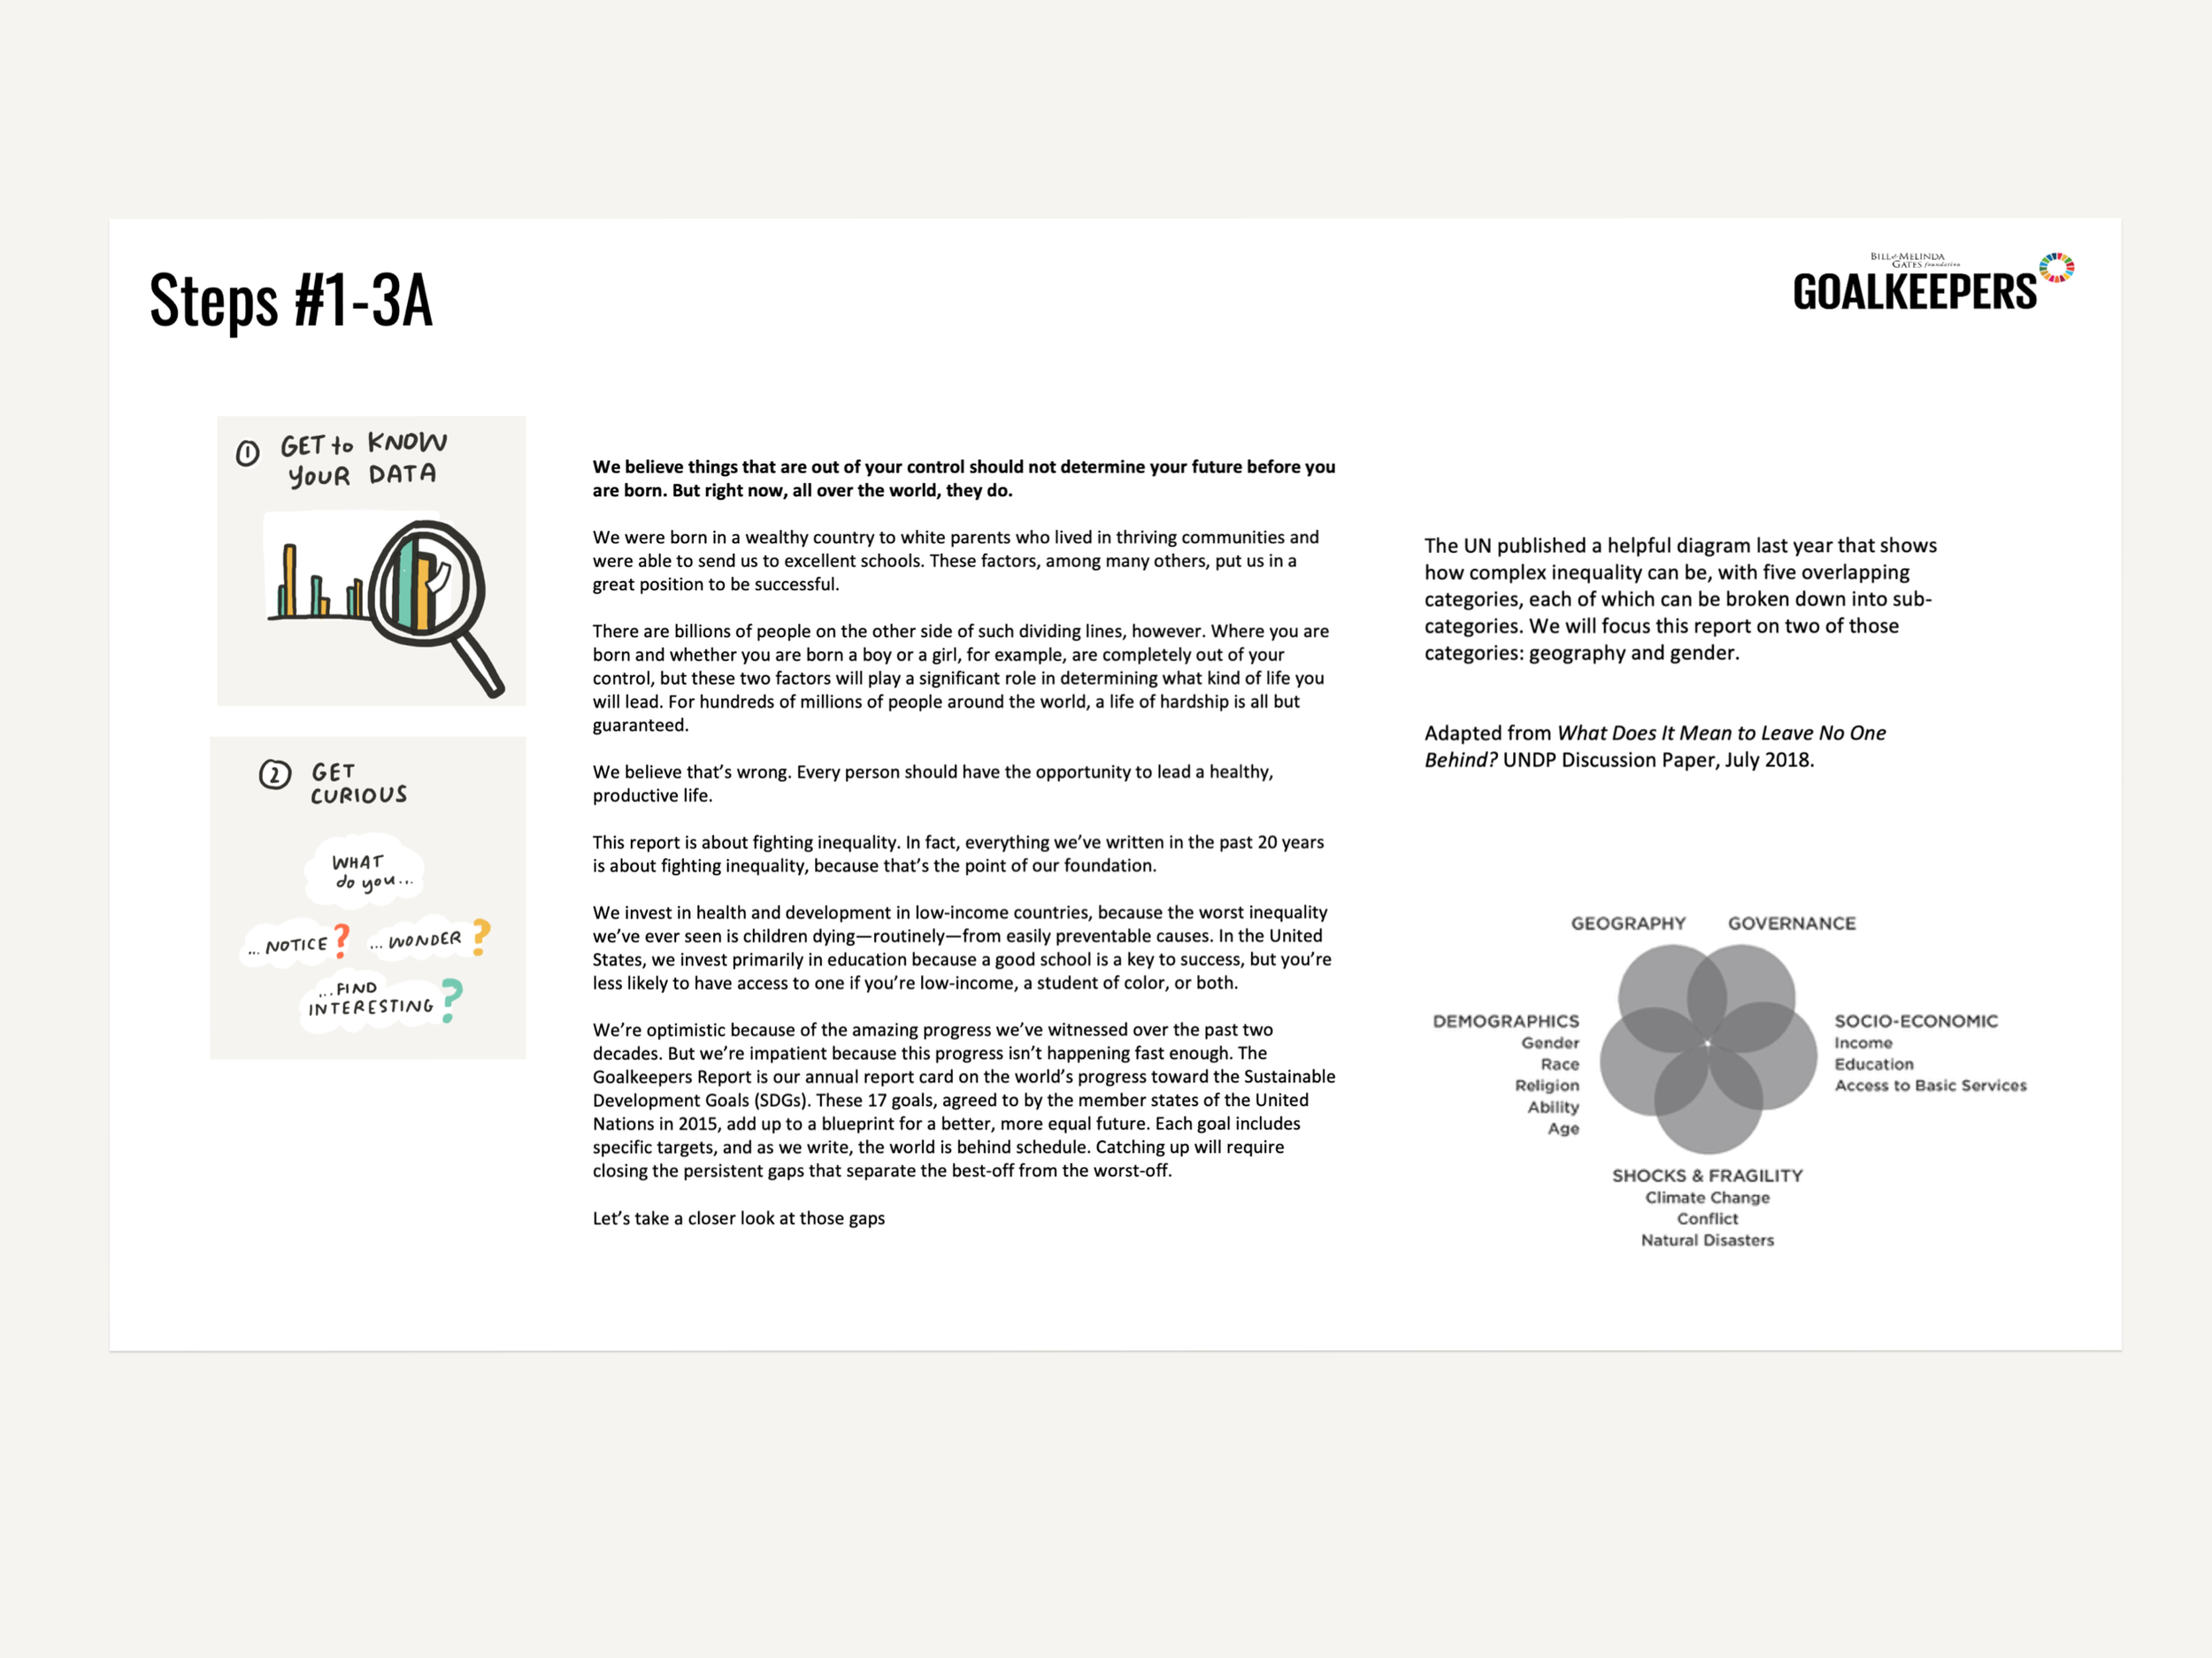
The workshops started with a brief introduction from Dr. Wanda Wyporska of the Equality Trust, who covered the general topic of inequality and introduced teachers to the specific charts and data sources that we would be working with. Next, I provided background on the hand drawn form and a process overview. We got to the practice and workshopping as quickly as possible so that we could give teachers a chance to practice the skills that they would in turn be bringing to their students. The group was so engaged and curious, and I found it really delightful to field their astute questions and view the doodles they created while following along.

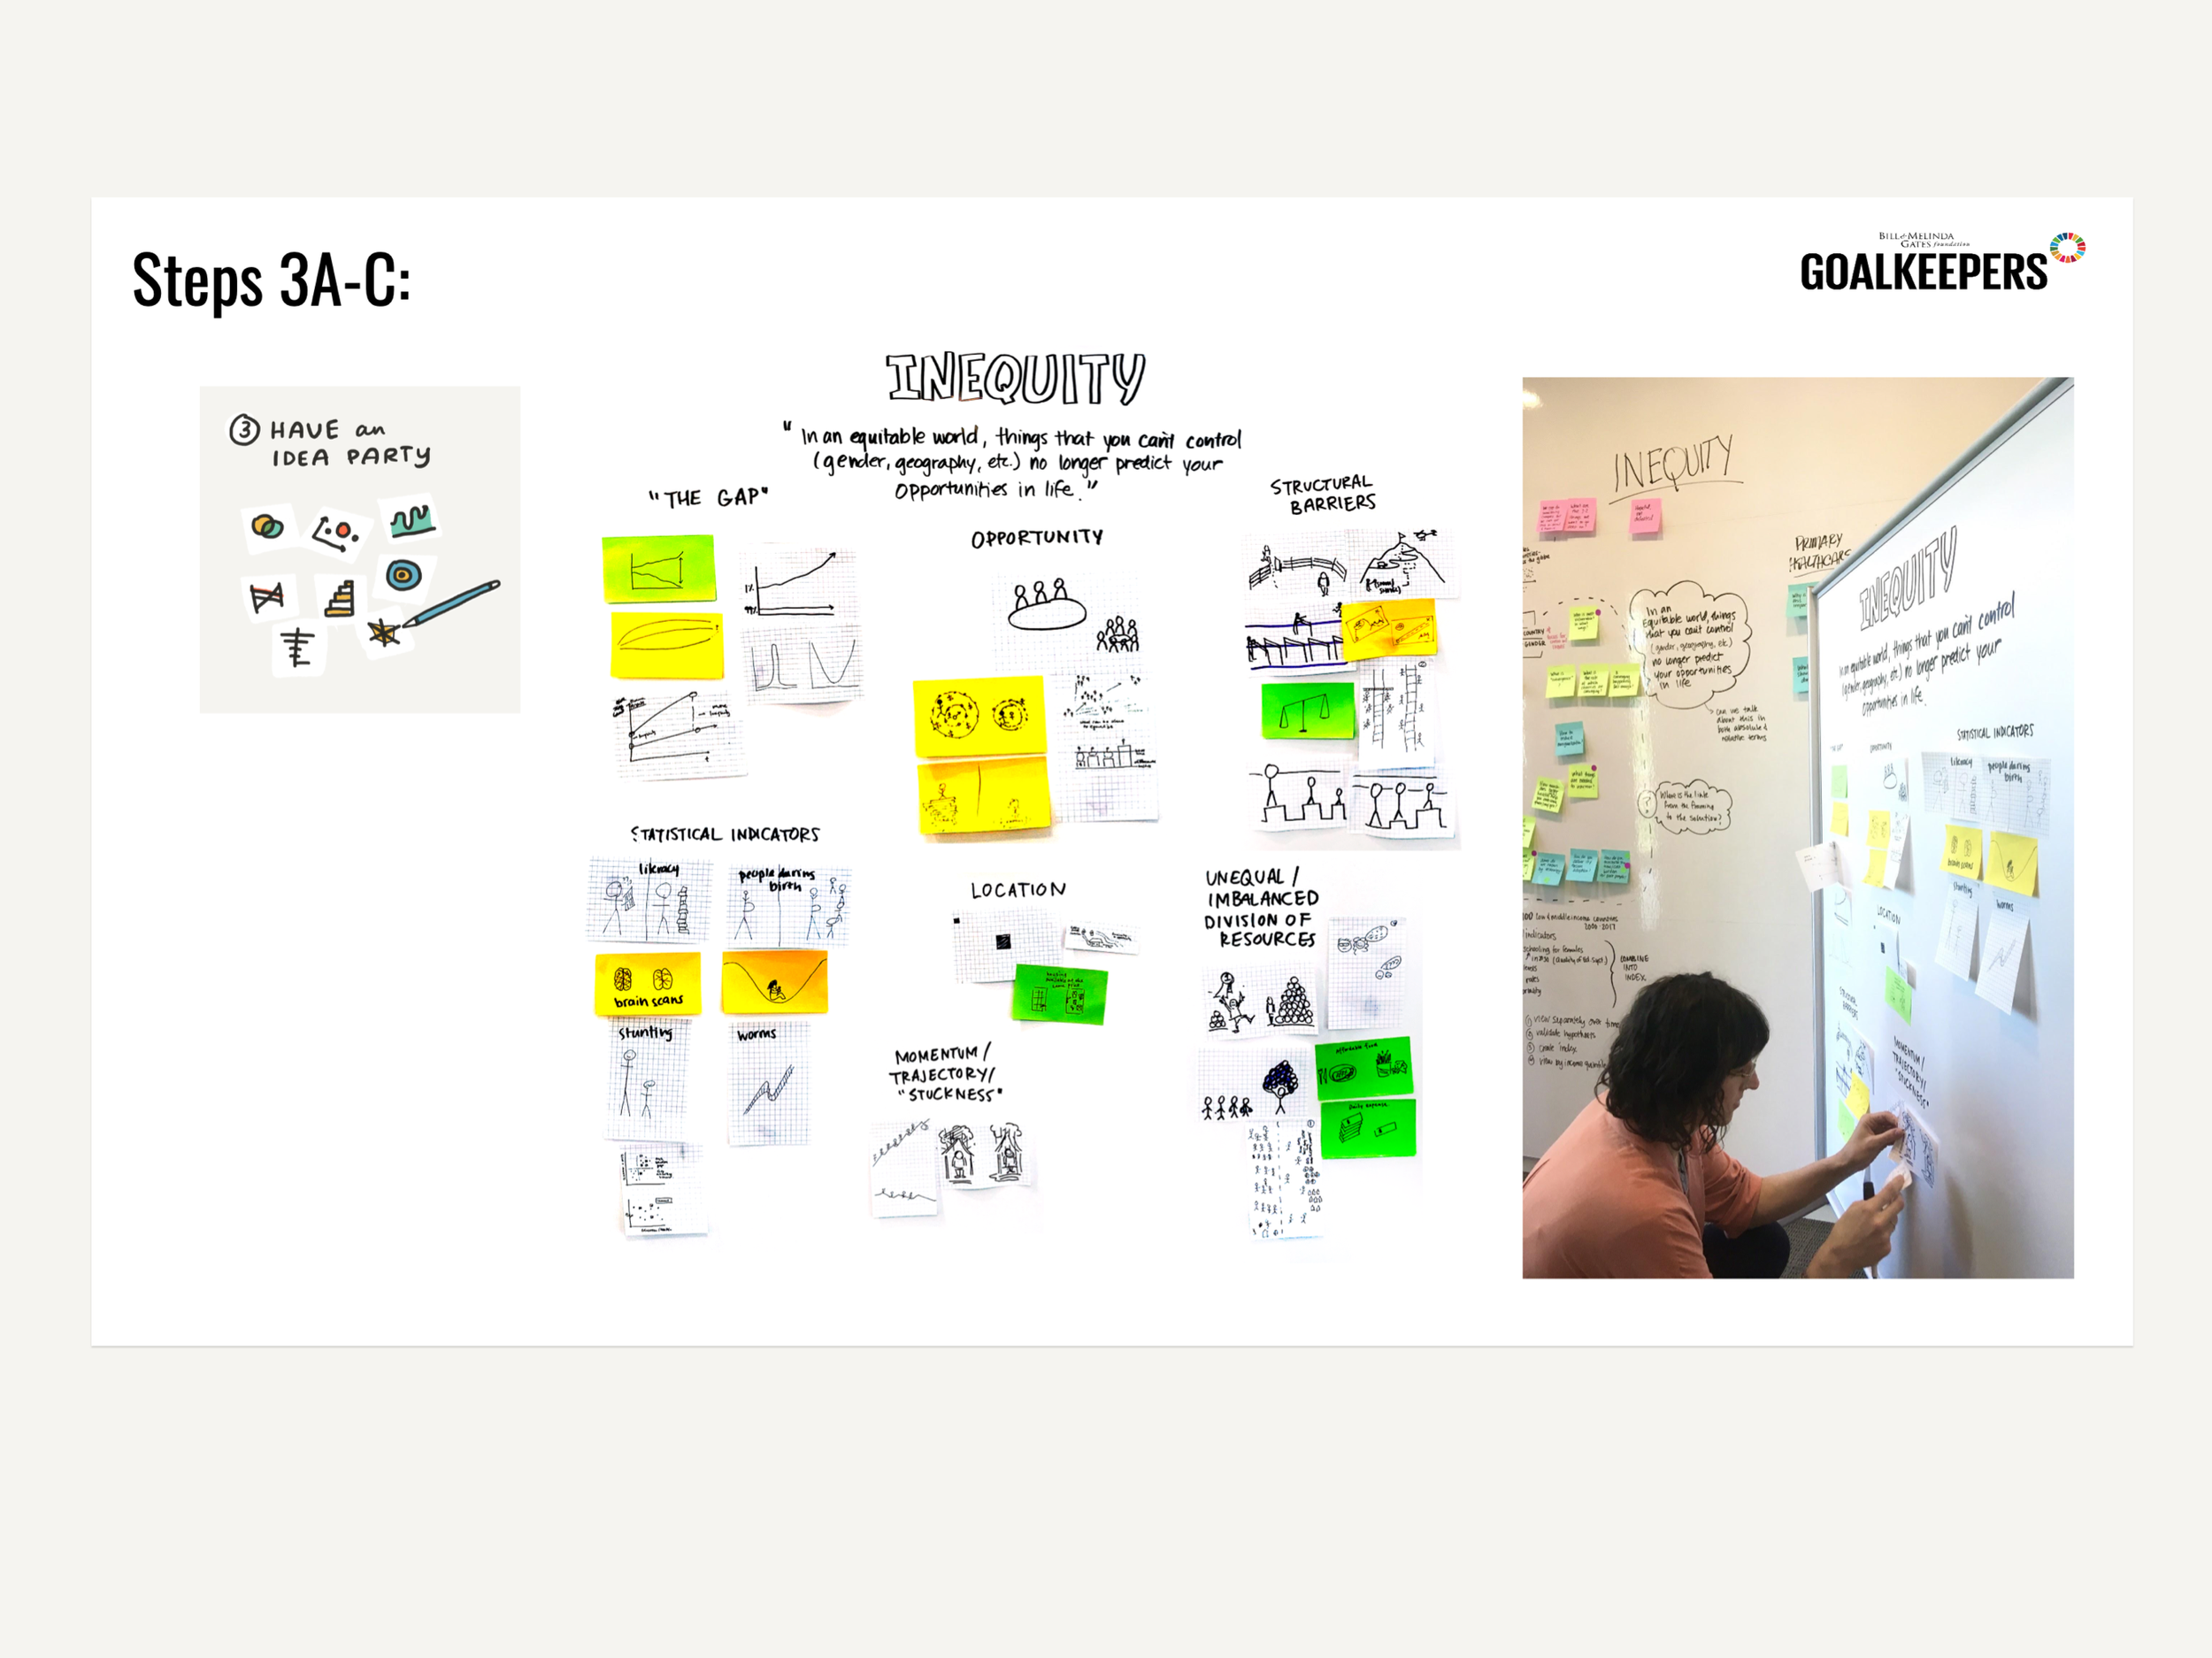
Workshop participants sharing their Idea Party creations
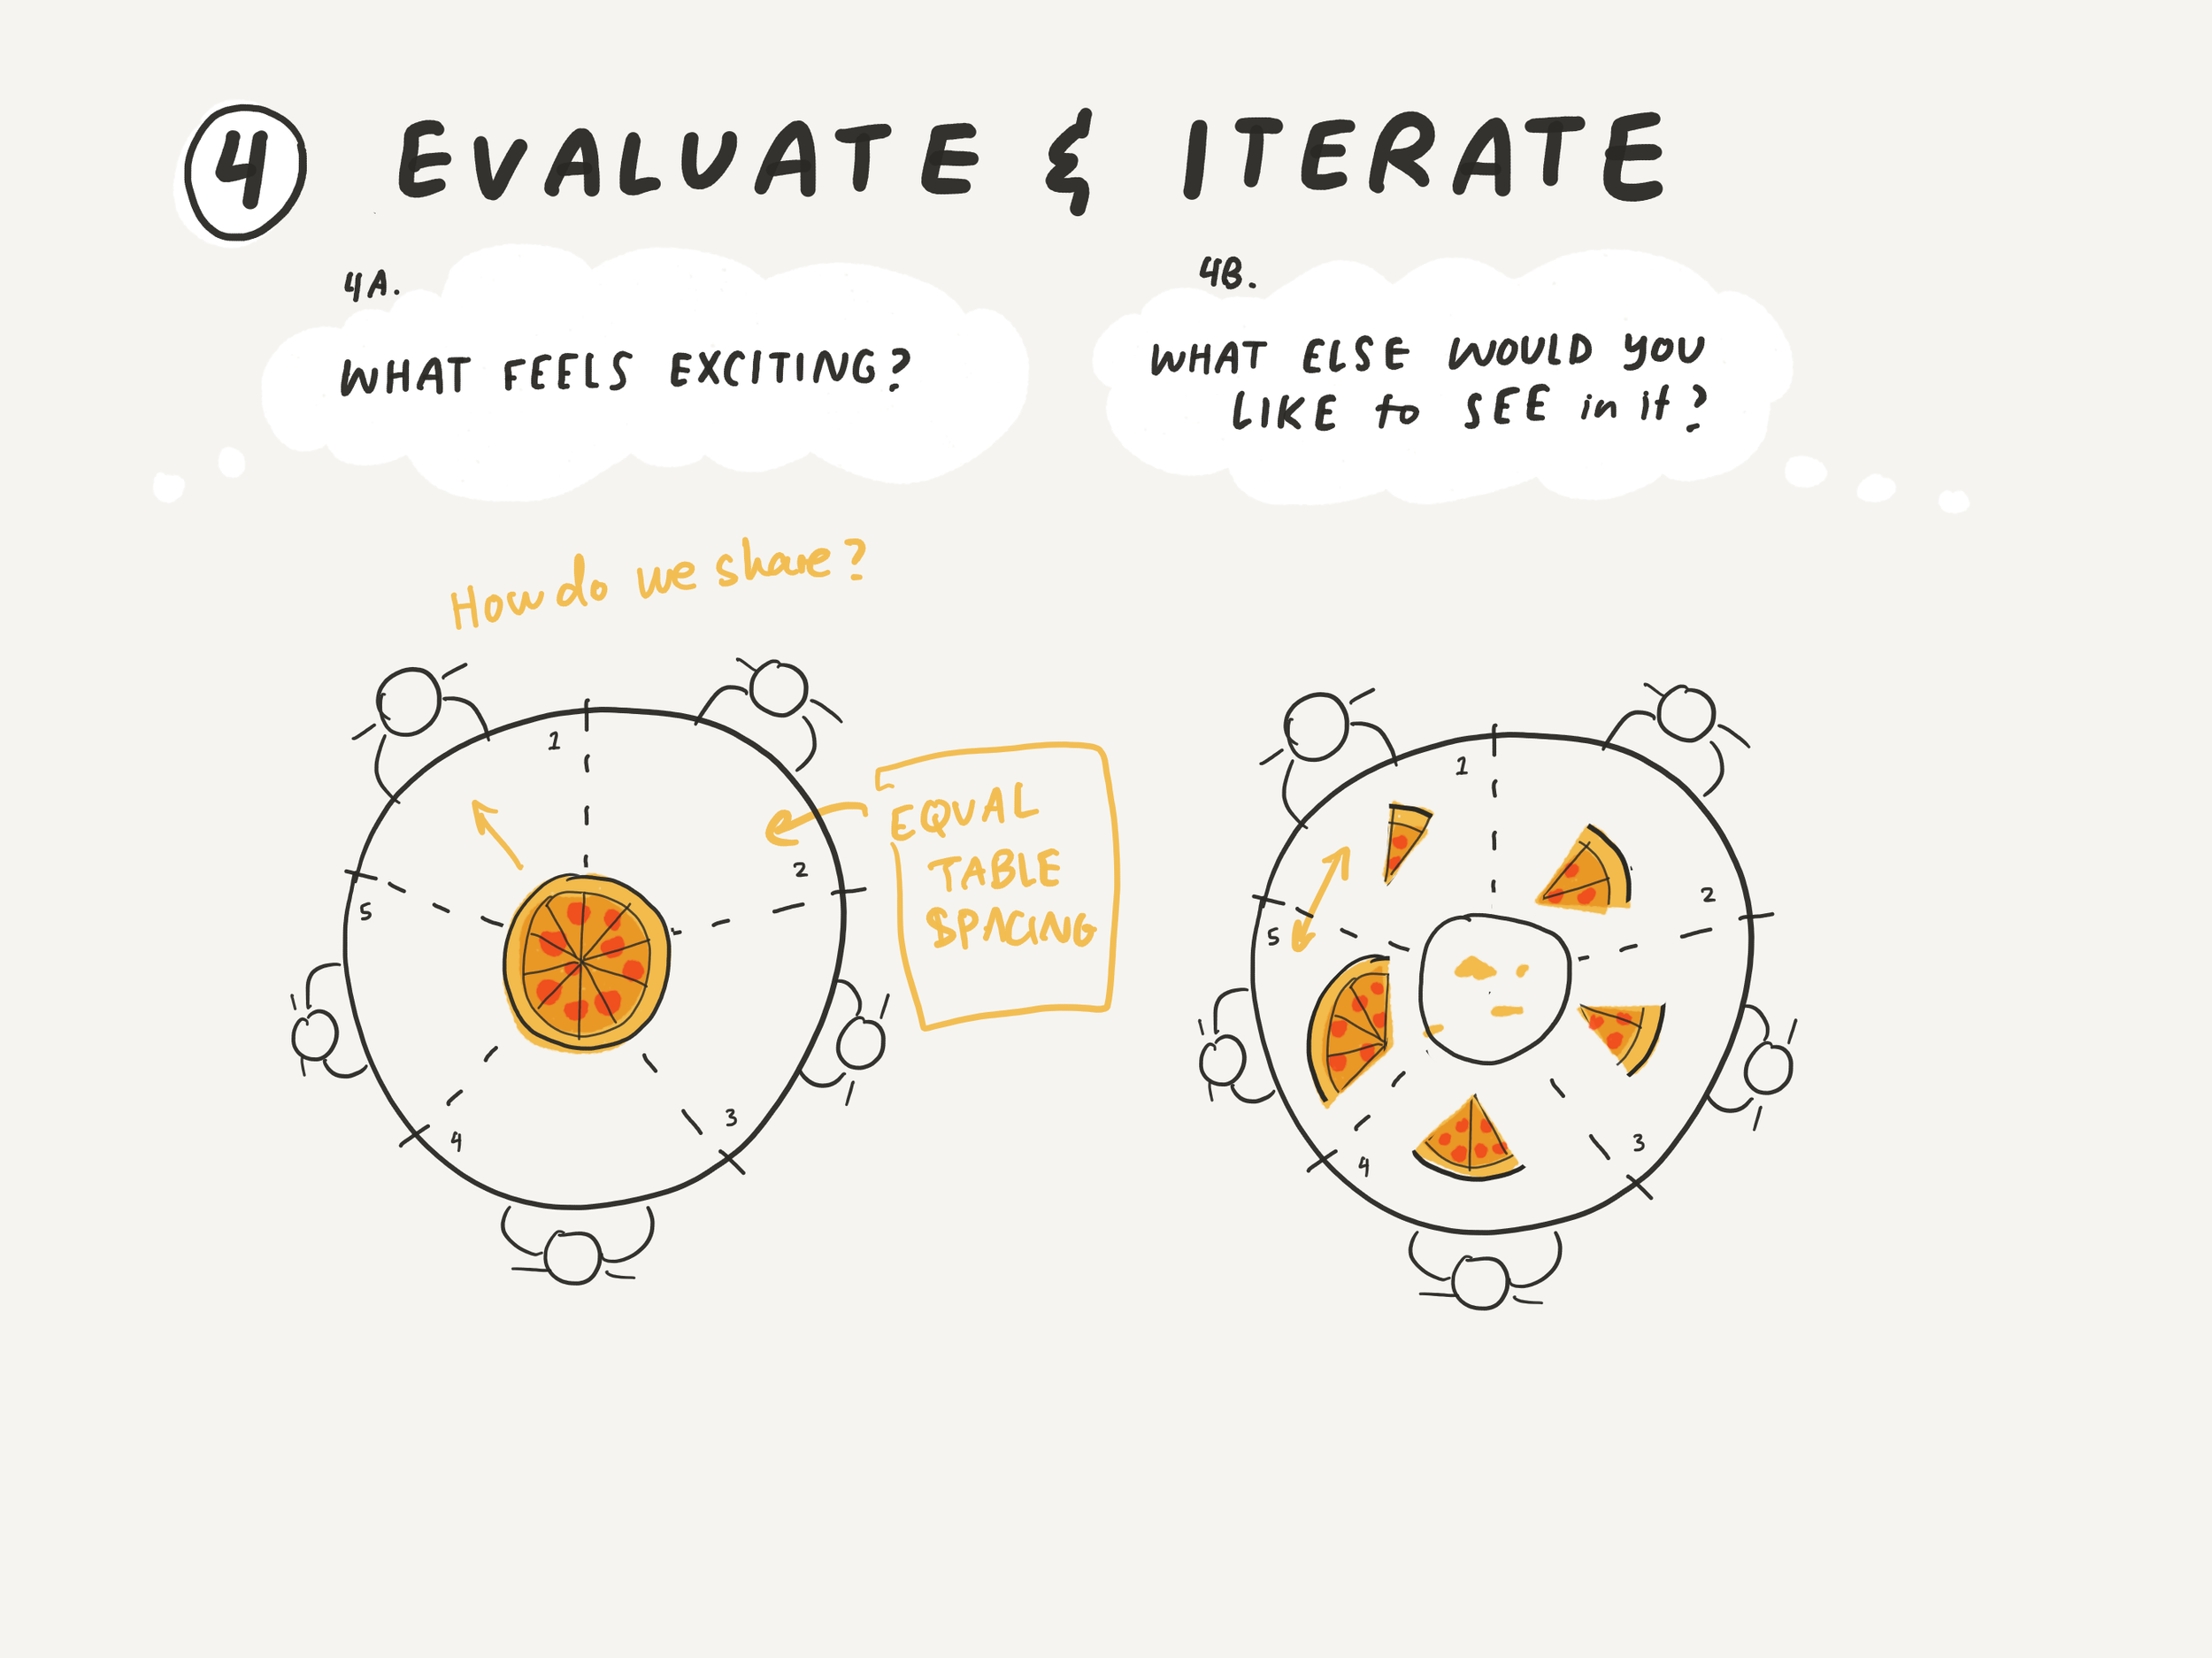
I invite you to take a scroll through the slides that I walked through during the class!
Supplemental Materials
The program resources page is where you can access every bit of additional material we created, including a suite of demonstration videos and an interview with Cat about my journey to data doodling. I’ve embedded one of the demonstration videos below in case you’d rather stick around here.
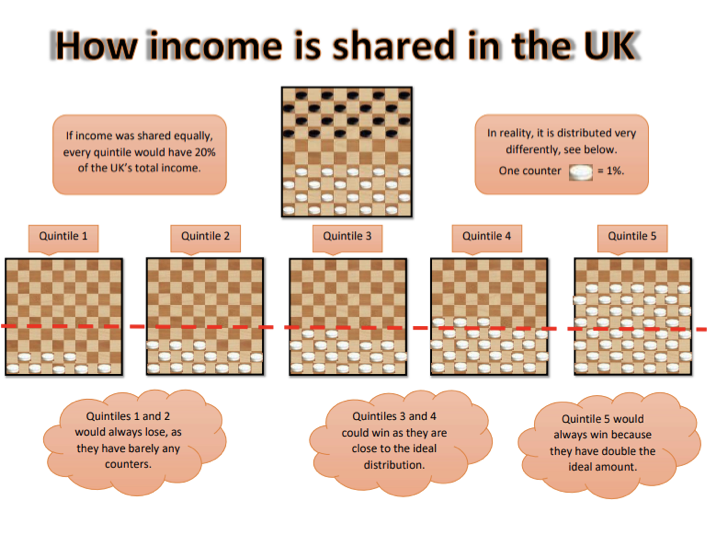
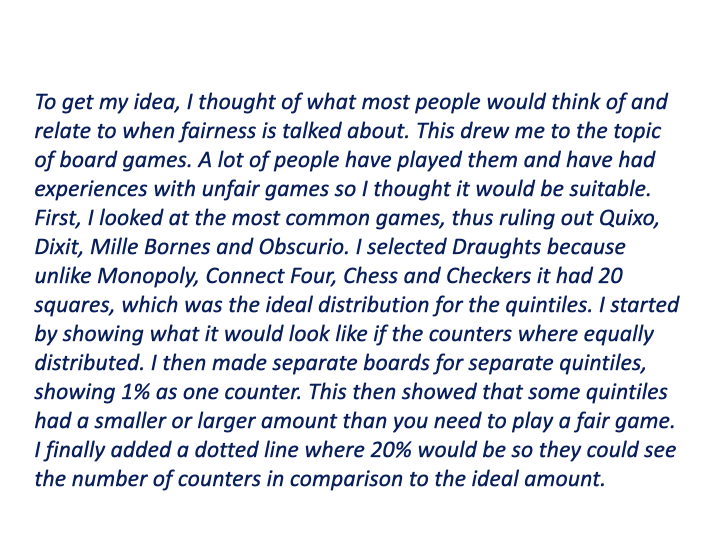
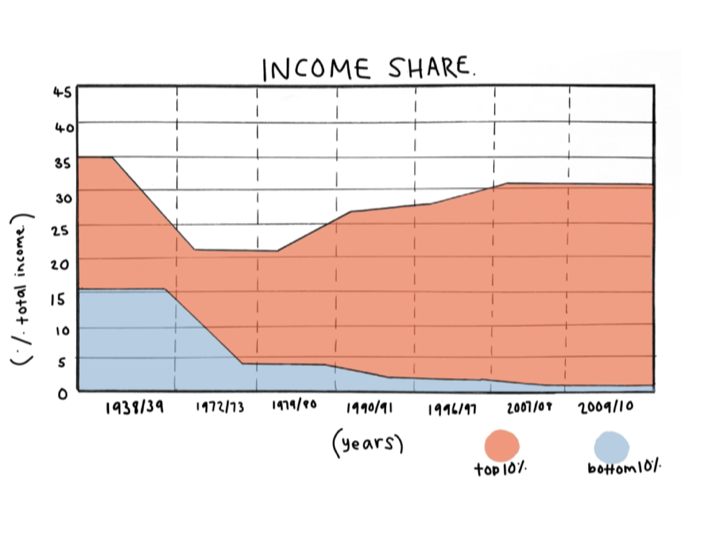
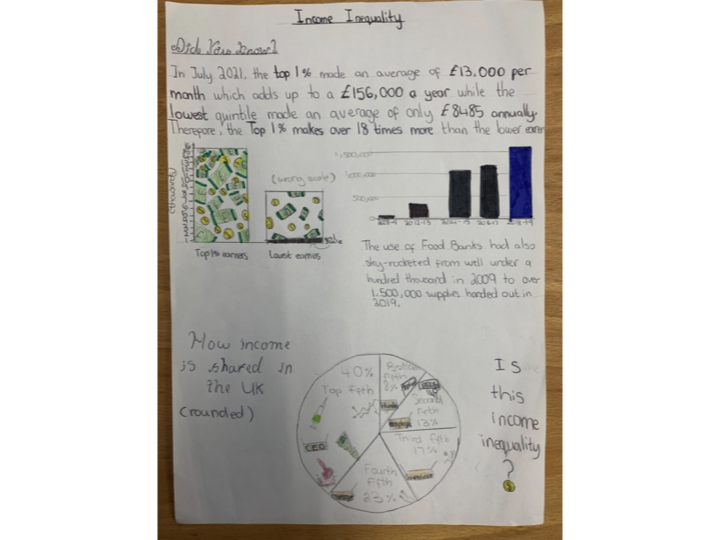
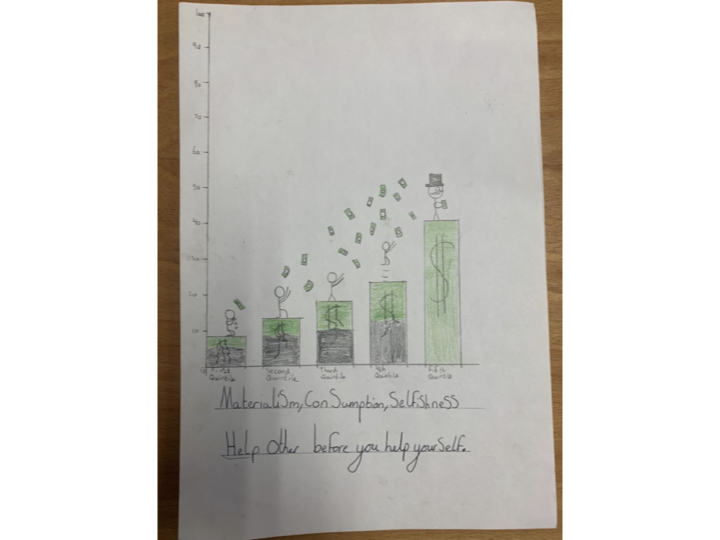
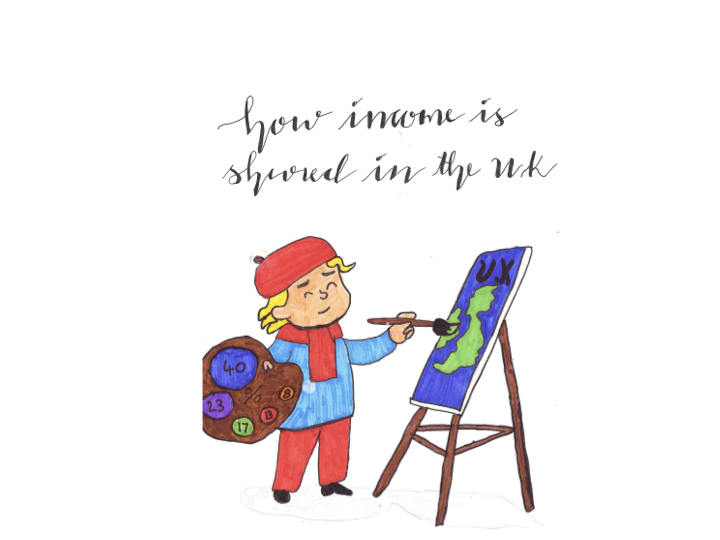
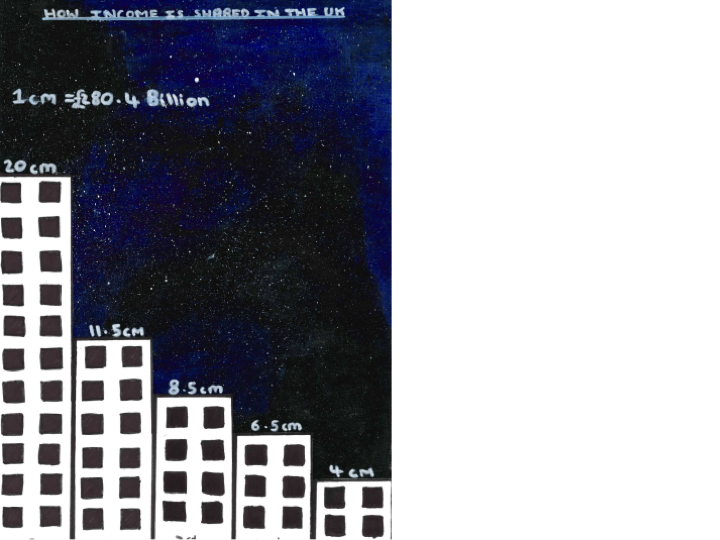
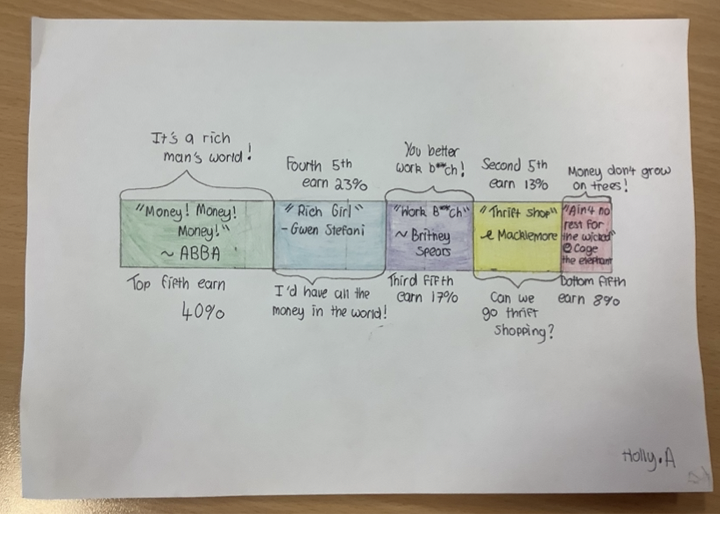
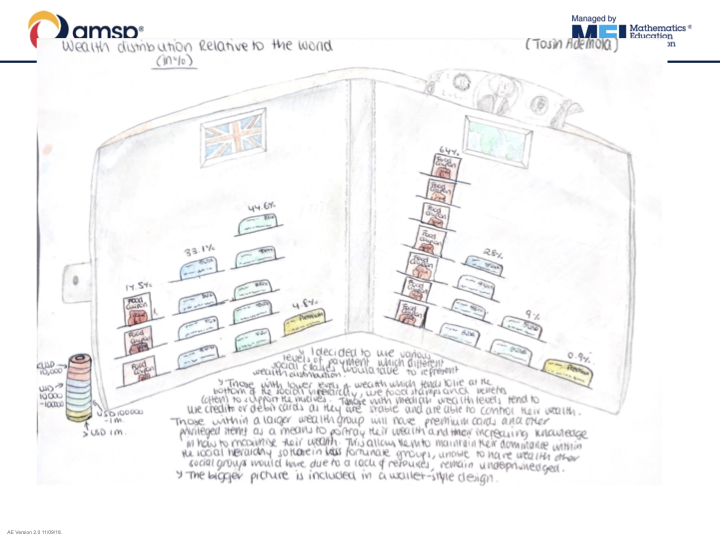
The Contest!
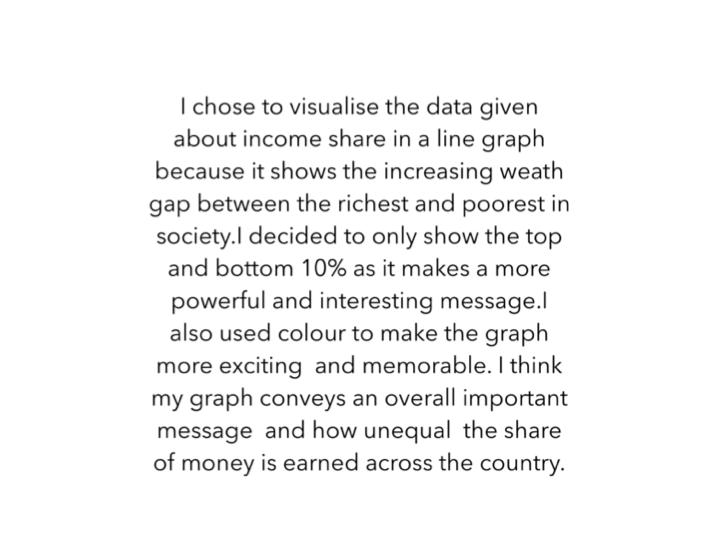
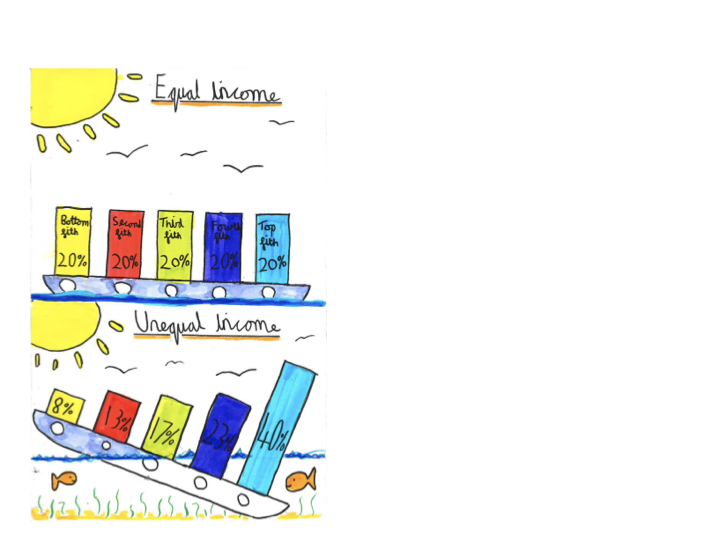
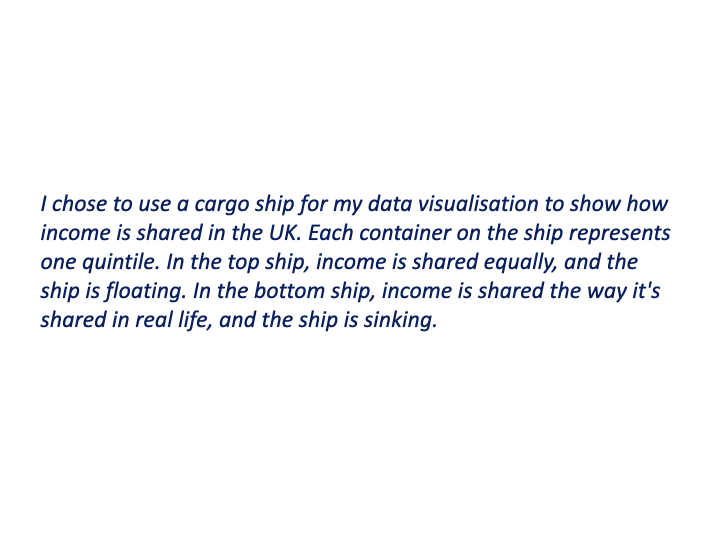
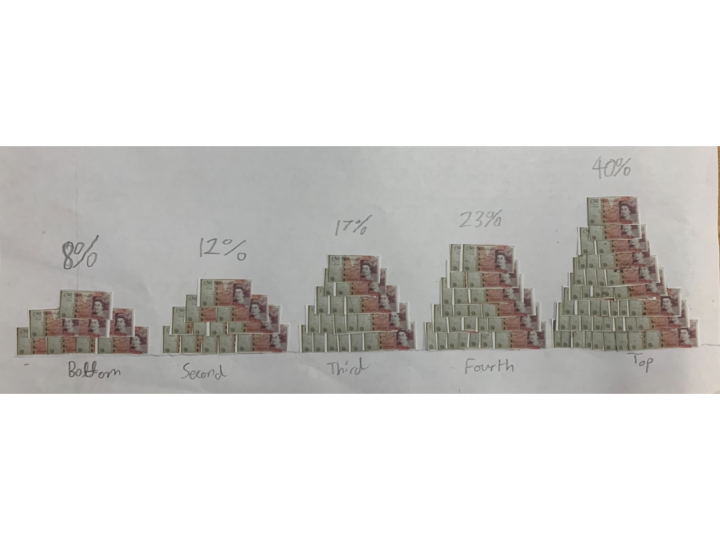
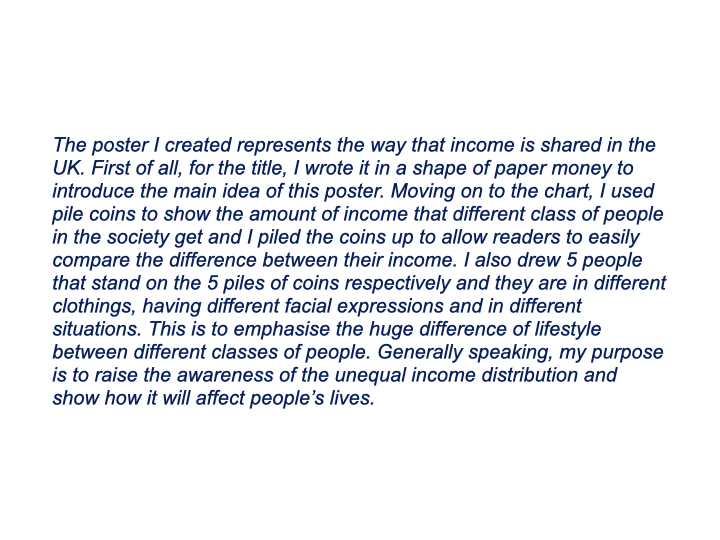
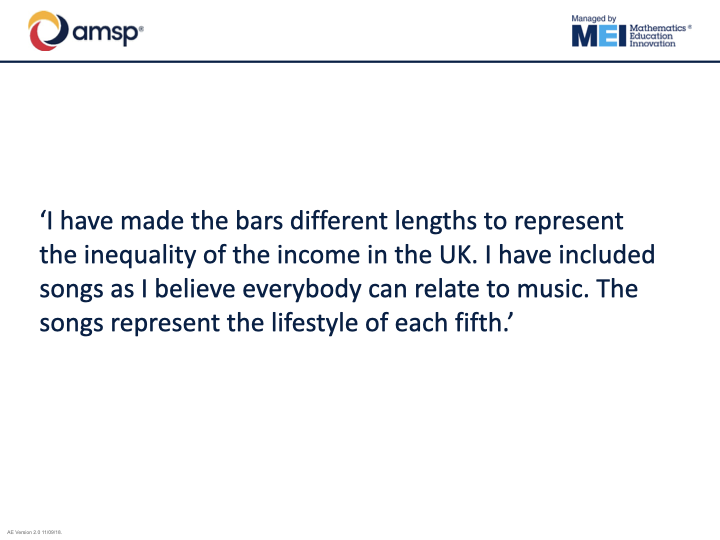
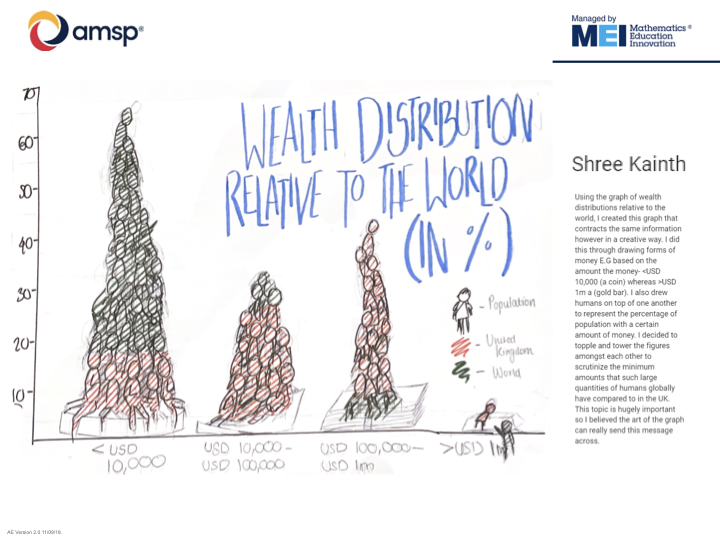
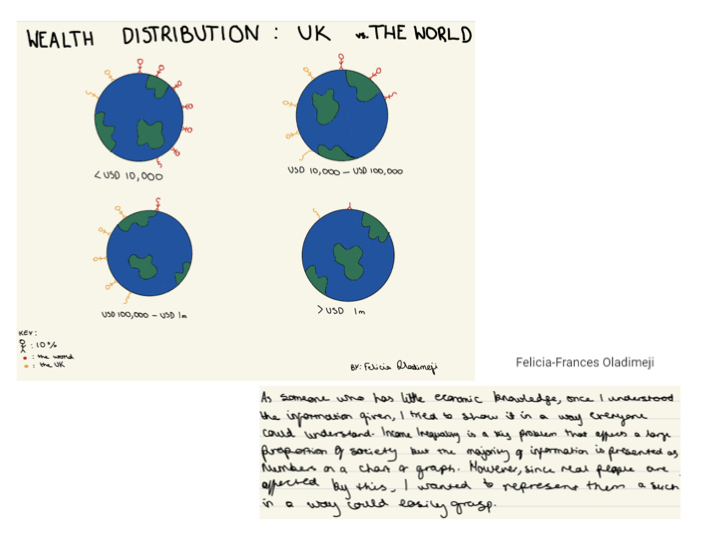
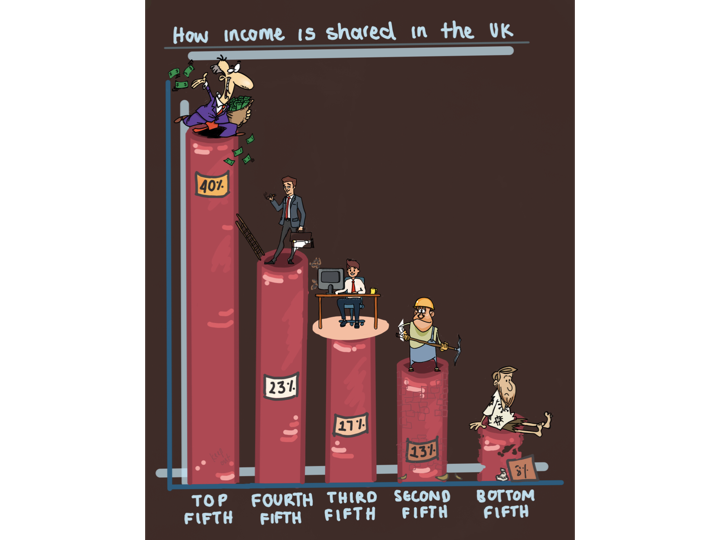
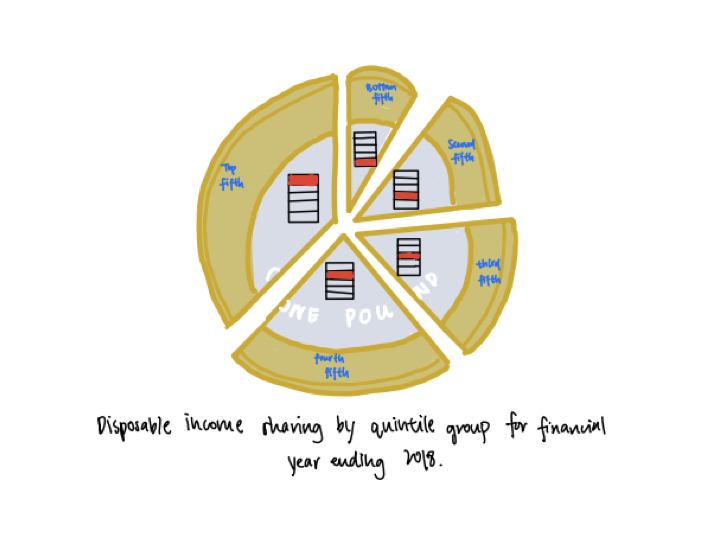
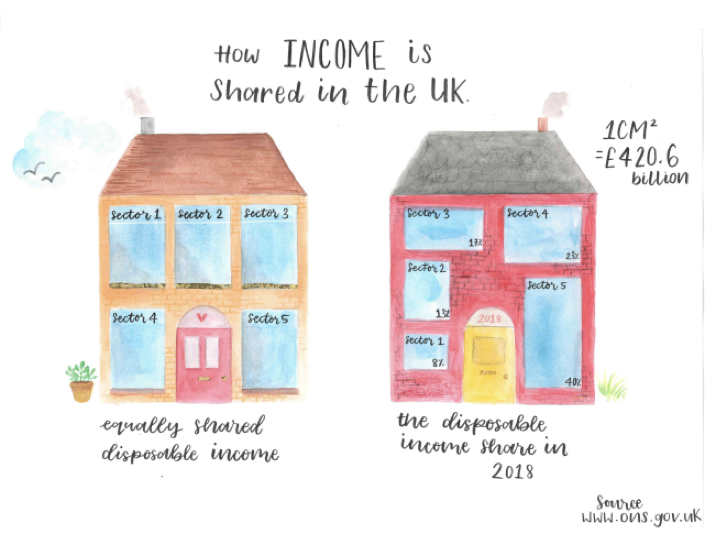
Everything I’ve described up to this point was truly a delight to think about and work on, but actually being able to see the student work that came out of the contest brought me a new level of joy. Cat and her team had narrowed down a set of finalists that a group of judges (including me) were asked to review. It was remarkable to me how well the students seemed to grasp the objectives, align with the contest rules, and simultaneously stamp their own creative hand on the subject matter. Take a gander through some of the truly novel visual forms and styles below— I hope you feel even a tiny bit as inspired as I did reviewing the work of these creative young people!
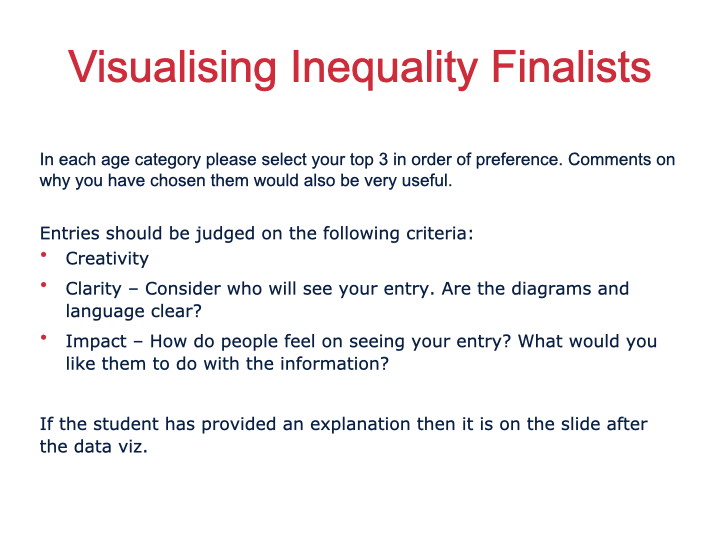
The competition winners were announced on the program website in Mid-December, and that was the conclusion for this wild and wonderful offering I feel honored to be a part of creating.