Journey Mapping, Emotional Waves, and Fiber Art Data Viz
/‘Every December, my friend Eugene hosts a gathering among friends, colleagues, and co-learning group members where he guides everyone through a process of reflection. In this process we map out the highs and lows of the past year. I have been able to participate two out of the past three years, and feel so grateful for the simple fact that I have people in my life who similarly value making time for reflection, connection, and art making.
2018 Recap
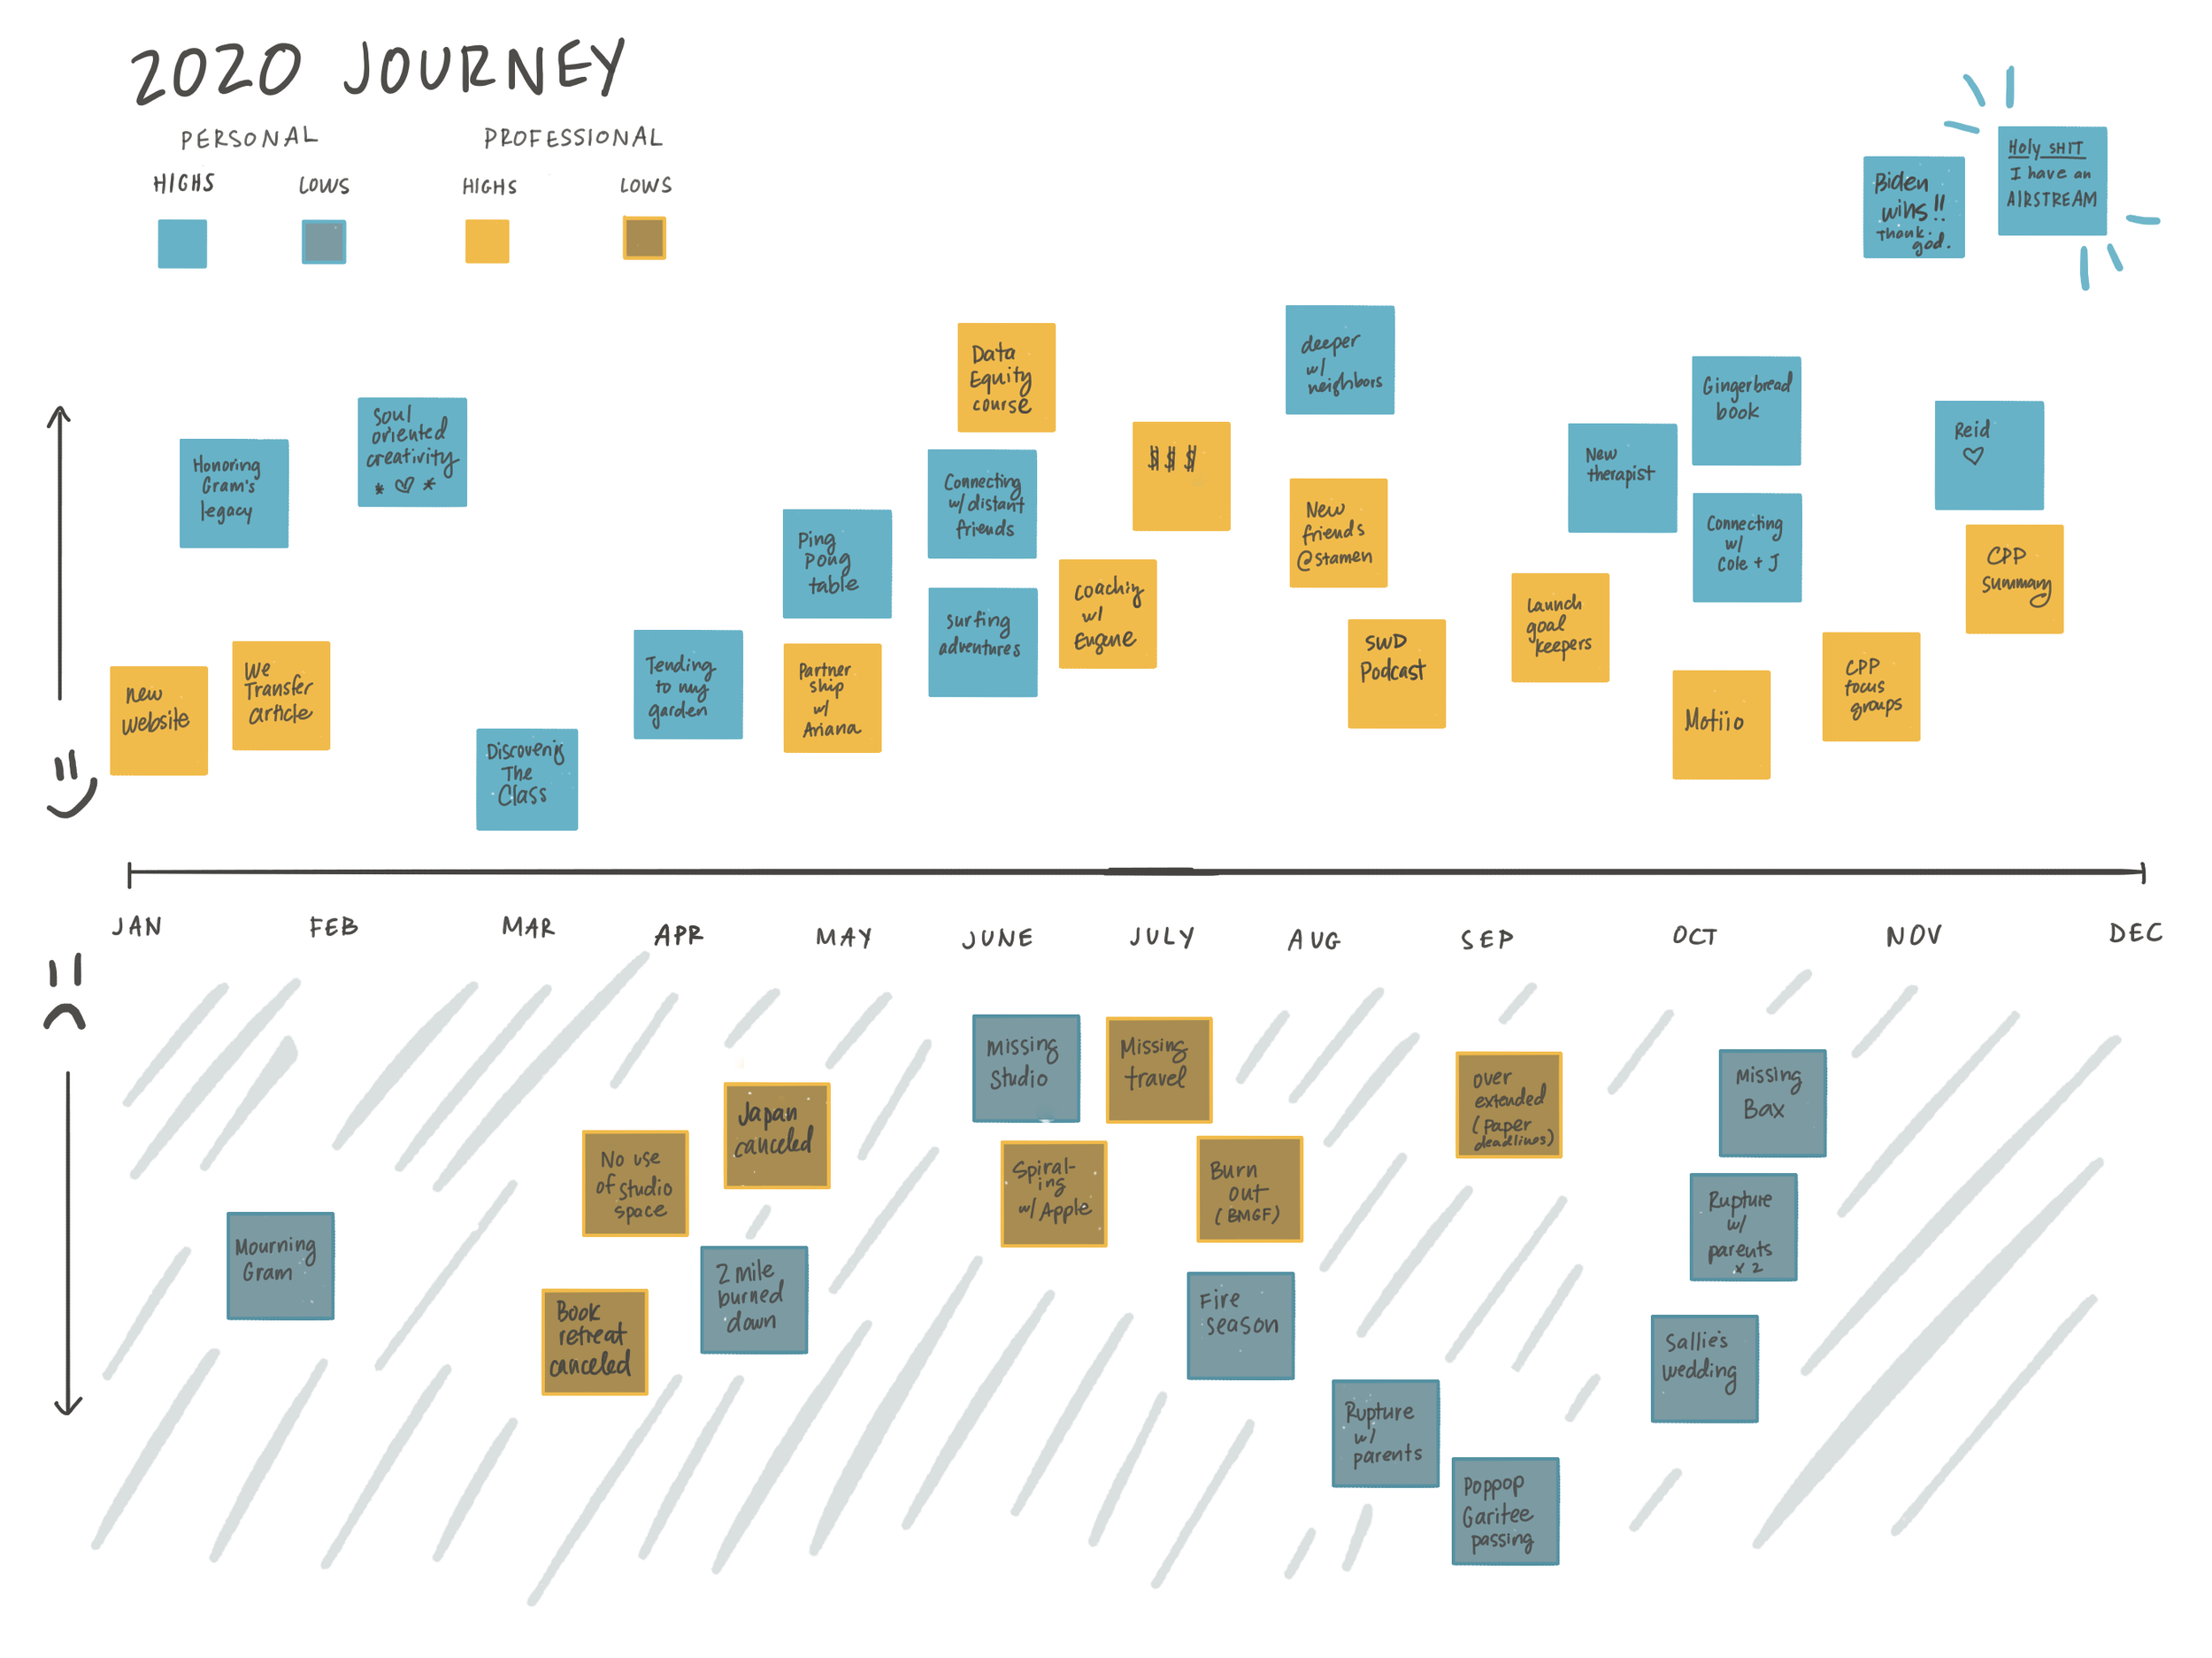
Two years ago, I had a blast creating this simple journey map that started with sticky notes and ended with some sort of layered line chart. Looking back two years later, it’s such a great summary of the highs and lows that felt so intense in the moment but now are distant memories.
Thanks for the photo, Eugene!
2020 Reveal
Presenting the final result up front so it’s easy to compare the two years…..
I wove a tapestry! The inspiration to use these materials came from the first part of Eugene’s group session. When everyone was checking in, my friend Kate showed me some old art supplies she pulled out of her closet to use for the project. I looked over at my craft closet which was spilling over with various leftover yarns and fibers from other craft projects, and determined right then to use these leftovers for this project. Now I have the final piece on display in my office as a reminder of the ups and downs of this insane year, and how we are always riding one wave or another. If you are curious, I share more about the meaning behind each square in the image descriptions at the end of this post.
I’ll update this post with a link to Eugene’s writeup when it’s ready, so you can see the range of other amazing artifacts that folks created.
The Process
Here’s what I created in part 1 of the journey mapping session. Eugene walked us through a process where we spent 10–15 minutes creating a sticky note list for each category: personal highs, personal lows, professional highs, professional lows. Then we mapped them on a timeline and placed them at a relative high or low distance that felt right.
In part two of the activity, each person was encouraged to create some art inspired by the journey. Everyone took a very different direction, and the data storyteller in me wanted to keep some of the structure of the journey map. My first step was to identify a set of categories that felt interesting to me— personal and professional blend together in so many ways that I wanted to look at the year by different dimensions.
Next, knowing I had a limited color set I decided to play around with what the weaving could look like. I drew one line per category of life that I identified earlier, and used the original journey map as approximate placement for the highs and lows. I actually love the look of this first attempt, but I wasn’t sure how I would execute it.
I played with a simplified approach that would look more like a modern tapestry, but it felt like some of the meaning behind it might get lost and it just wasn’t vibing for me.
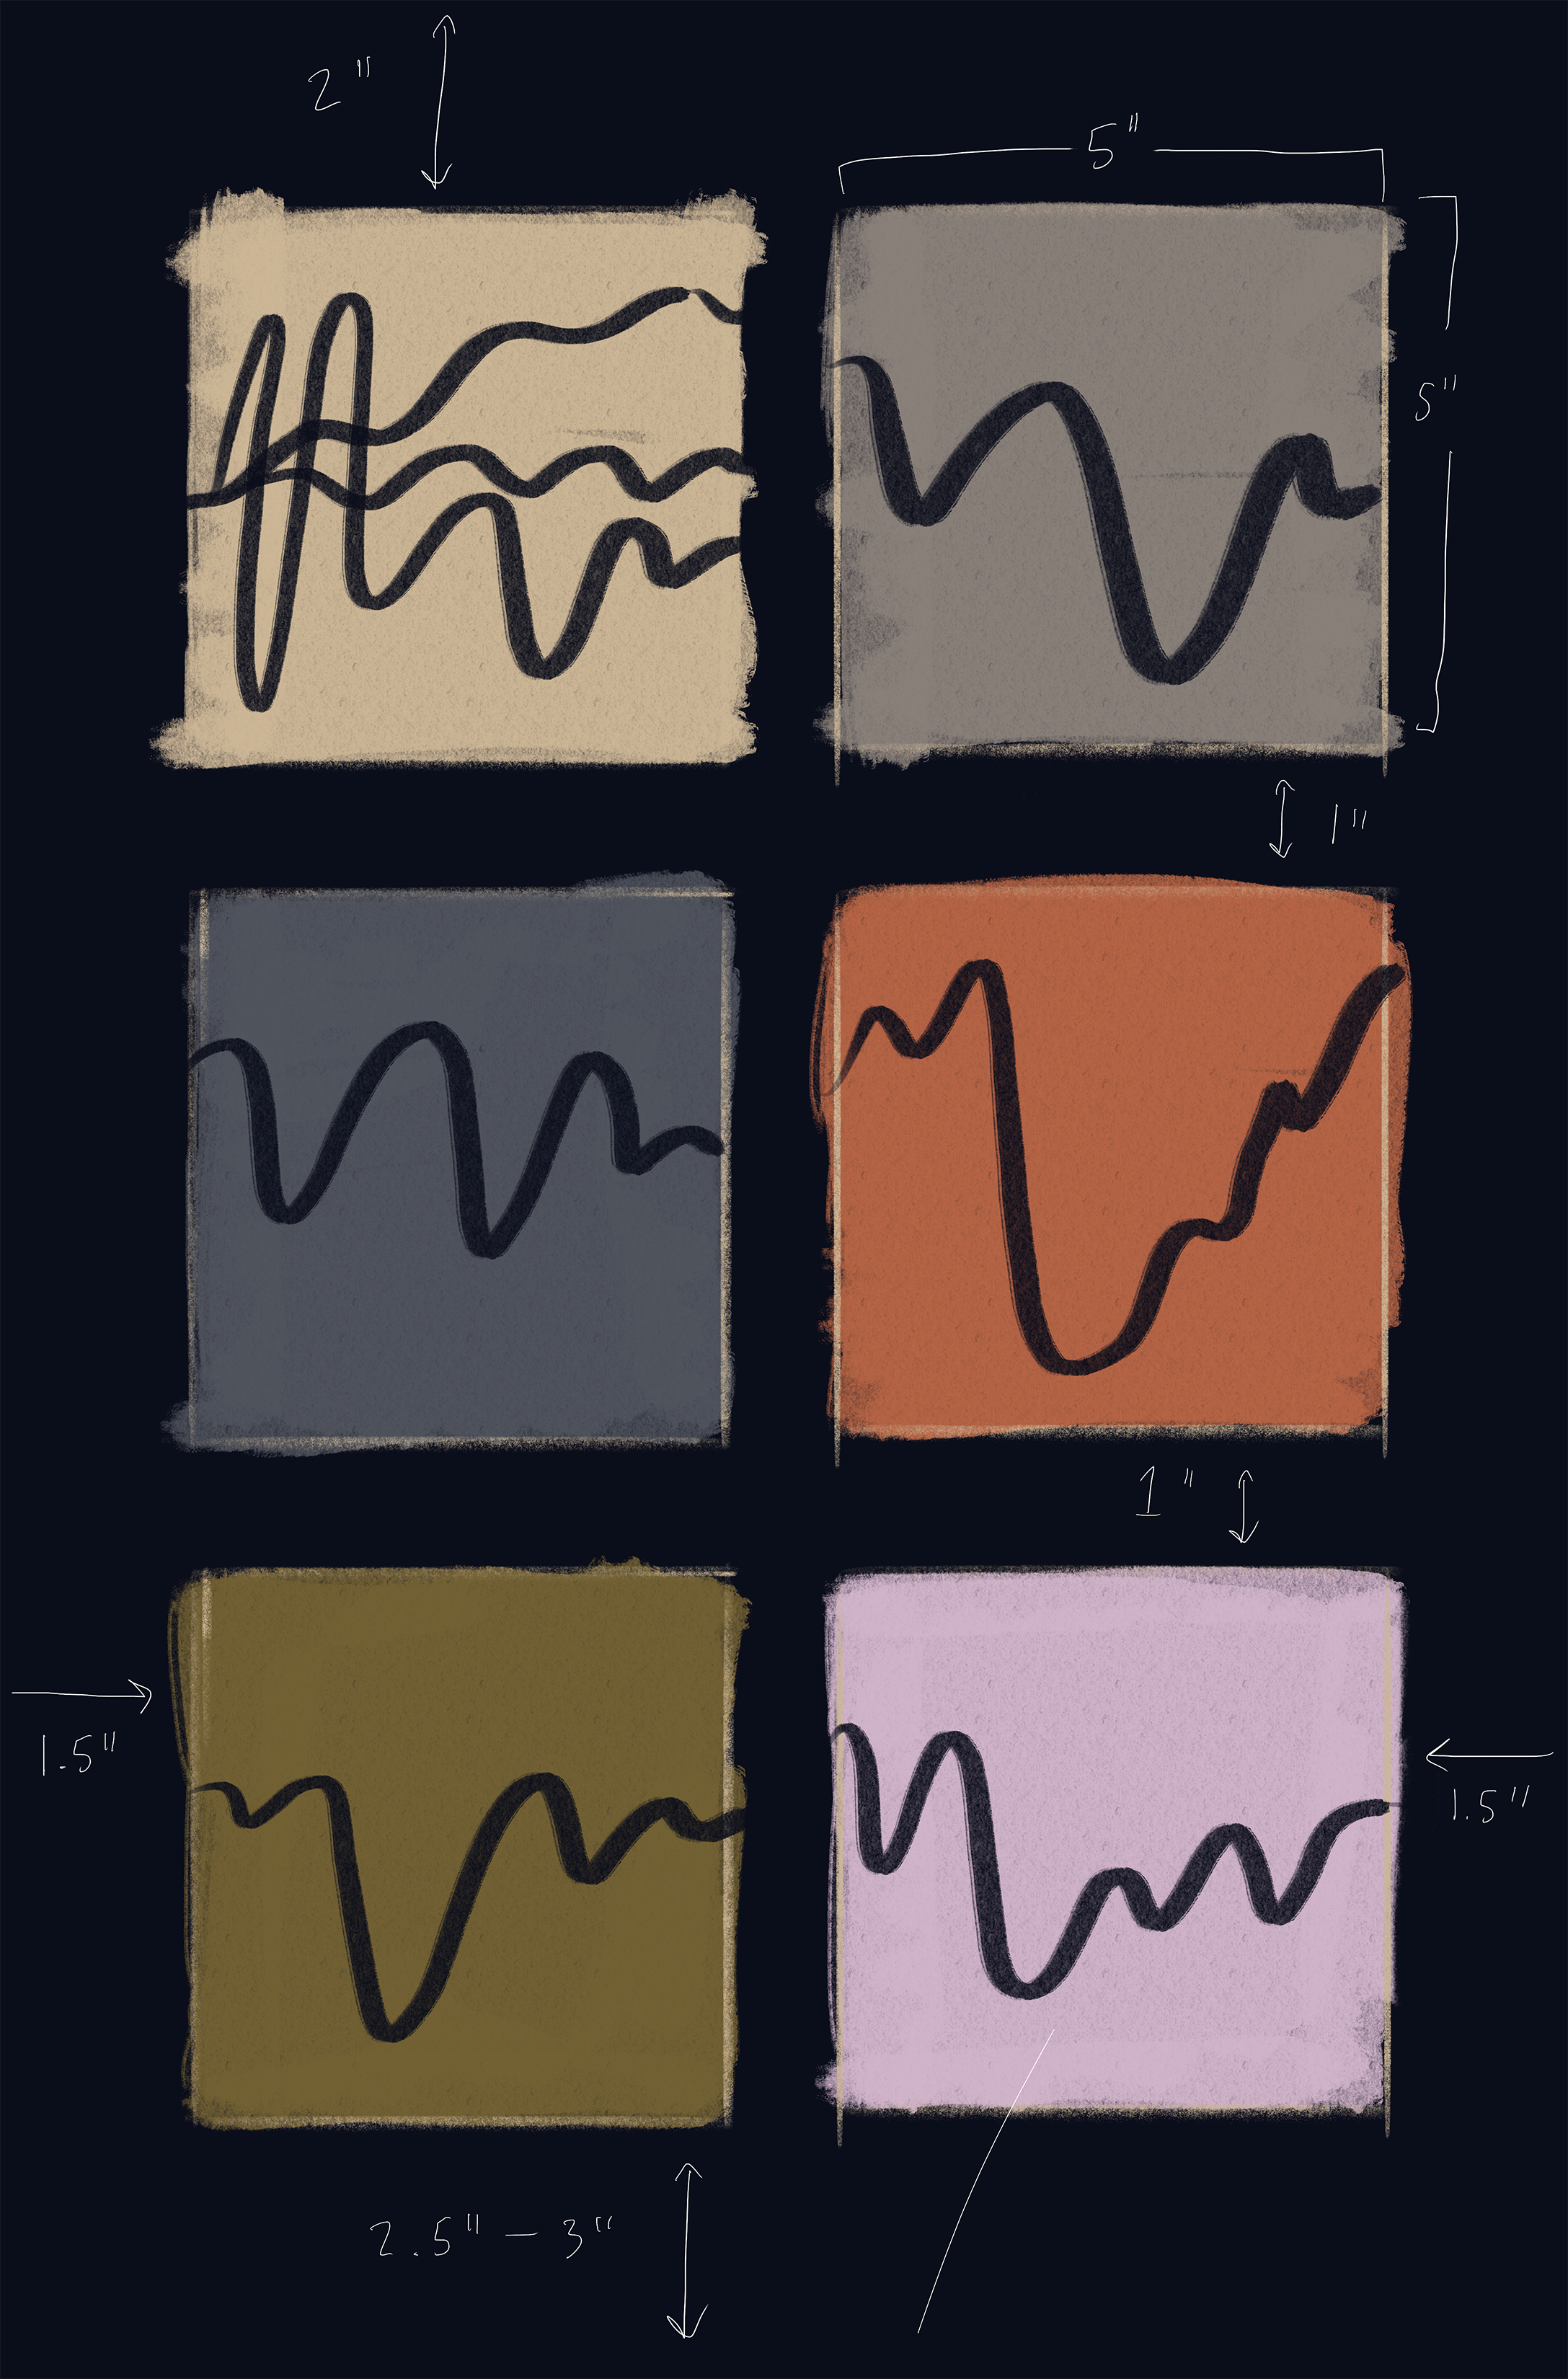
I went back to the first set of lines and split them apart into small multiples. This felt like I was onto something. You can see my note for measurements on this page because at this point I realized I needed to do some space planning based on the size of my loom.
Here’s the scale mockup I created to help me map out the colors and sizing.
Then I got to weaving! First I filled in the background space, then I reevaluated the colors and placements.
Thank you, Shonda Rhimes, Netflix, and Bridgerton for helping me breeze through the more tedious parts of the weaving process!
I veered away from the original categories I created, in favor of something that not only included my personal experience but also what was happening in the world. I sketched out six charts, three for me (relationships, projects, and adventure) and three external (Covid cases, Air Quality, and average tide heights in San Francisco). I traced the shapes with jewelry wire, wrapped the wire with floral tape, and then coiled the yarn around each line.
Here I am getting ready to affix the lines to the color blocks. This was at approximately 10:30pm on New Years Eve. Wild and crazy times.
As promised, here are some notes on the meaning behind each line. What strikes me upon looking at both columns, the top lines are so much less volatile, but in past years that type of wave pattern would have felt extreme. But 2020 brought a whole new level of extreme for everyone and with it for me, greater resilience and clarity.


