References for my DataViz DC Talk
/Warning: This is a long post that contains a ton of images and links!
I am speaking at the December Meetup for Data Viz DC, a subgroup of the DC Data Community. (wow, three links already!). In my talk, I reference many inspiring artists, practitioners, and articles from around the world. I expect people to ask for a copy of the slides and my references, so this post is the answer that question. For the rest of this post I'll just follow the sequence of my talk and some of the "slides". The complete deck will be posted once I've had time to figure out where the best place to do that is.
Part 1: Visualizing my story
To start out, I share a visualization of my own journey.

Where I'm headed with my latest endeavor

My personal evolution via Sankey diagram

A visualization of my career path

And a more simplified visual

Examples of Hand Drawn Data Vizzes

More examples!
- Jessica Hagy (index card visualizations)
- Melanie Feliciano (from DC Night Owls meet ups)
- Skillshare class (commute visualizations on project page)
- Compelling class project
- Other Hand Drawn Data Visualizations on Pinterest
- Carl Richards NYT financial napkin charts
Part 2: The group participates
To wrap up the intro, I challenge the group to create their own hand-drawn illustration. The best two will win prizes, chosen via a contest on Twitter.
- All of the tweets from the meetup (winners and link to hashtag TBD)
- The prize book: 100 Diagrams That Changed the World by Scott Christianson
- The other prize
Part 3: Five Things from Catmule
The main part of my talk is around sharing five things about design, drawing, data, and digital. For each of the five things, I answer the questions What is it? What should I do about it? and Where can I learn more?
1. Design Thinking is everywhere (even for data!)

What is important to know about Design Thinking

A visual framework for the upfront process of Design Thinking

Recent publications on Design Thinking that I thought were valuable to share
- Design Thinking Comes of Age (Harvard Business Review)
- IBM Design Centered Strategy on NYT
- Creative Confidence
2. Visualization is a spectrum

Overview of data visualization spectrum

A visual framework for design process

Resources for more on data visualization spectrum
- Article about the spectrum from Andy Cotgreave of Tableau
- Functionality or Beauty? Books to Help You Choose (another Cotgreave post)
- Robert Kosara's Visual Storytelling in an Age of Data webinar
3. Data viz dogmatism

A visual summary of the current backlash against dogmatism

Some suggestions for how to decide when to break the rules
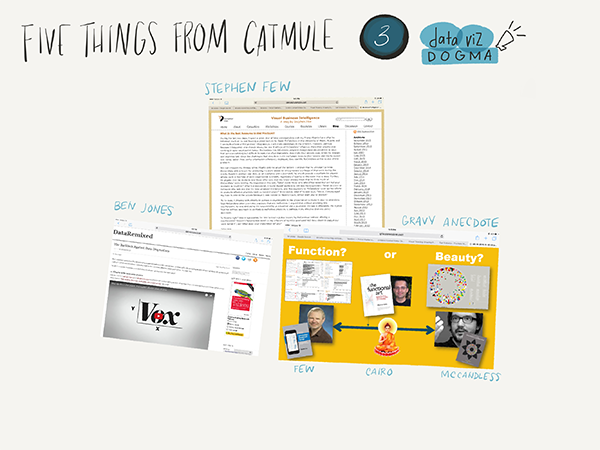
Articles referenced on data viz dogmatism
- Shut Up about the Y Axis video from Vox
- The Rules to Breaking the Rules (Fast Company)
- What is the best response to bad practices? (Stephen Few vs. David McCandless)
- Backlash Against Data Dogmatism (Ben Jones post on Data Remixed)
- Best books for the fundamentals (same link to Cotgreave article above)
- Data + Design by Trina Chiasson
4. Define what "Insight" means to you

A visual depiction of my definition of insight

A visual framework for developing and sharing them

Interesting references when thinking about developing and sharing insights from data
- Insight Moves Beyond Marketing (warc.com article)
- Kelvy Bird's Iceberg Model for Storytelling
- Hannah Fairfield's Tapestry Talk
- Sketchnotes from all of the Tapestry Talks
5. Find & use tools that empower
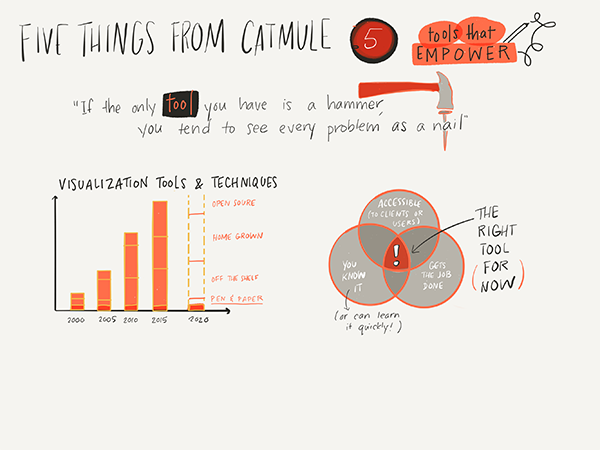
How do you know when you are using the right tools, and are developing the right skills?

Just my suggestion to set yourself up for success

Resources to learn the breadth of the tools and techniques is to collect them all in a visual space
- Doodle Revolution by Sunni Brown
- The Back of the Napkin by Dan Roam
- All of my Pinterest boards
And that's it! Hope your browser doesn't crash from all the links :)