


1
2
3
4
5
6
1. All of my projects start with a mind map, using only information and questions in my own mind. Then I research where to find the answers to the questions this process sparks.
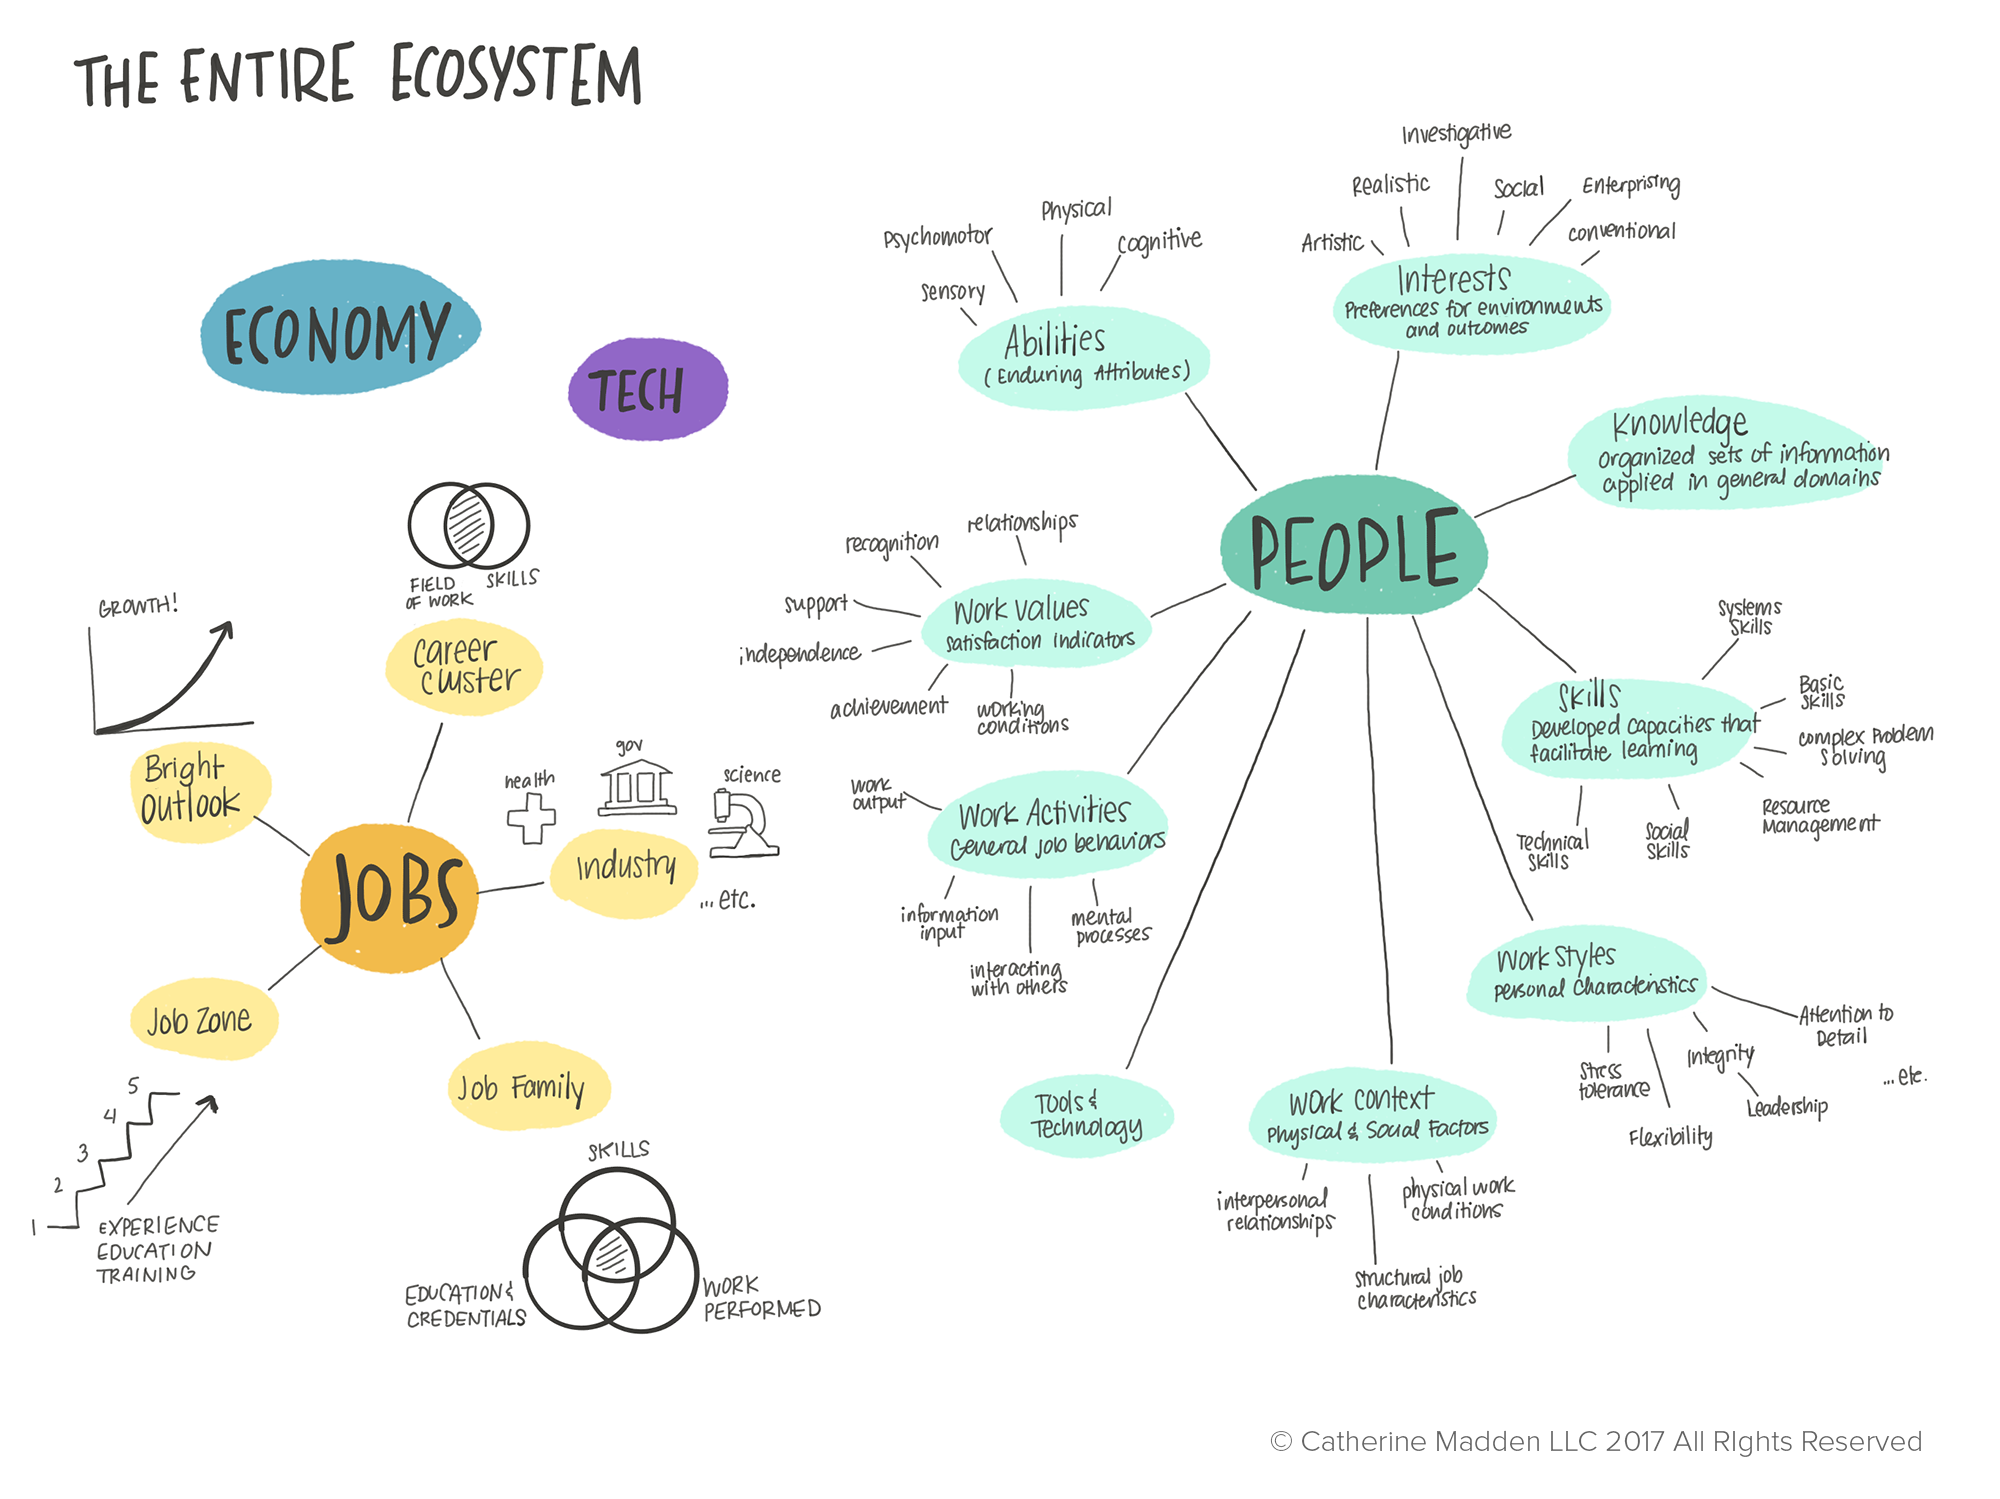
2. I created this second mind map after reading the WEF Future of Jobs report to better understand the way the authors categorized the issue.
3. After I have explored some initial data on the computer, I'll create some Shitty First Drafts on my iPad. Here are a few SFDs I made just to get some of the junk ideas out of my head.
4. At some point we finalized the project budget, which allowed for three static images. This format led me to hone in on a field-guide format and three key story points.
5. Once we honed in on the format and story points and had a sense of which specific datasets would support it, we focused on the visual elements.
6. Reason #4,512 why drawing your ideas is important: it is so much easier to try new things on the fly and make decisions about which format and approach will work best.
Catherine Madden LLC is a creative consultancy specializing in visual thinking and data storytelling.