Catherine Madden
  • Home
  • Relay
  • About
  • Learn
Catherine Madden
  • Home/
  • Relay/
  • About/
  • Learn/
  Drawing Data.  A commute from Skillshare student,  Sandra Martin . 
Catherine Madden

Skillshare Classes

Catherine Madden
  • Home/
  • Relay/
  • About/
  • Learn/
  Drawing Data.  A commute from Skillshare student,  Sandra Martin . 

Drawing Data. A commute from Skillshare student, Sandra Martin. 

  Drawing Data.  Class project submitted by Skillshare student  Joshua Ganyon . 

Drawing Data. Class project submitted by Skillshare student Joshua Ganyon. 

  Sketchnotes.  Doodles from a TED Talk from Skillshare student,  Emy Eriksson . 

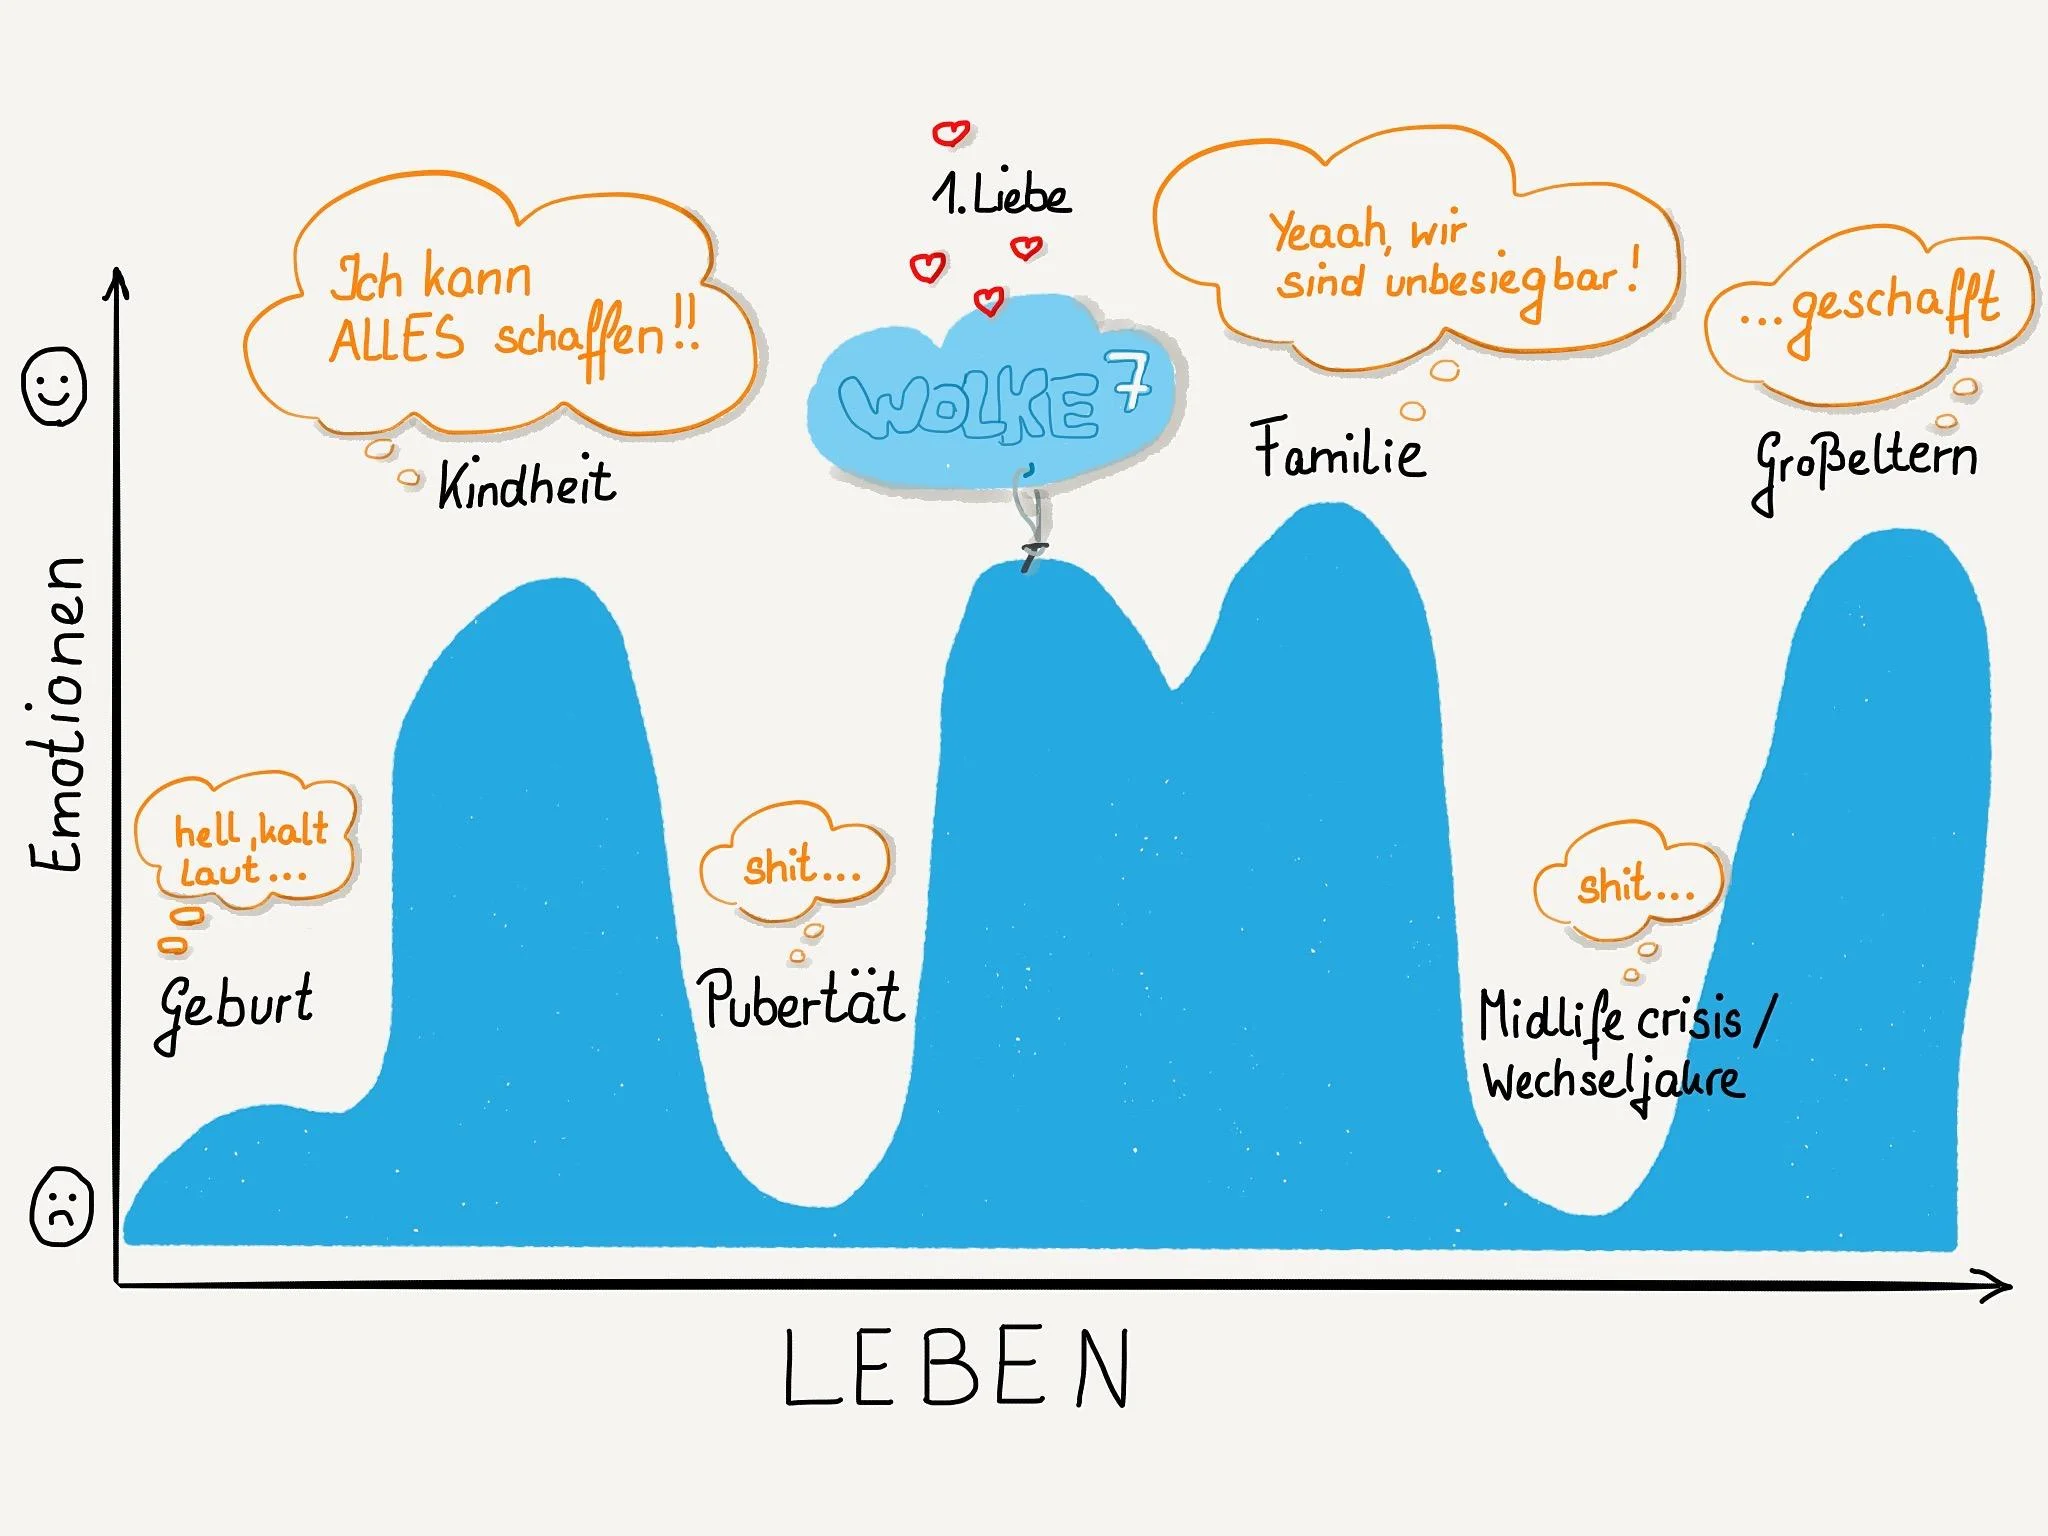
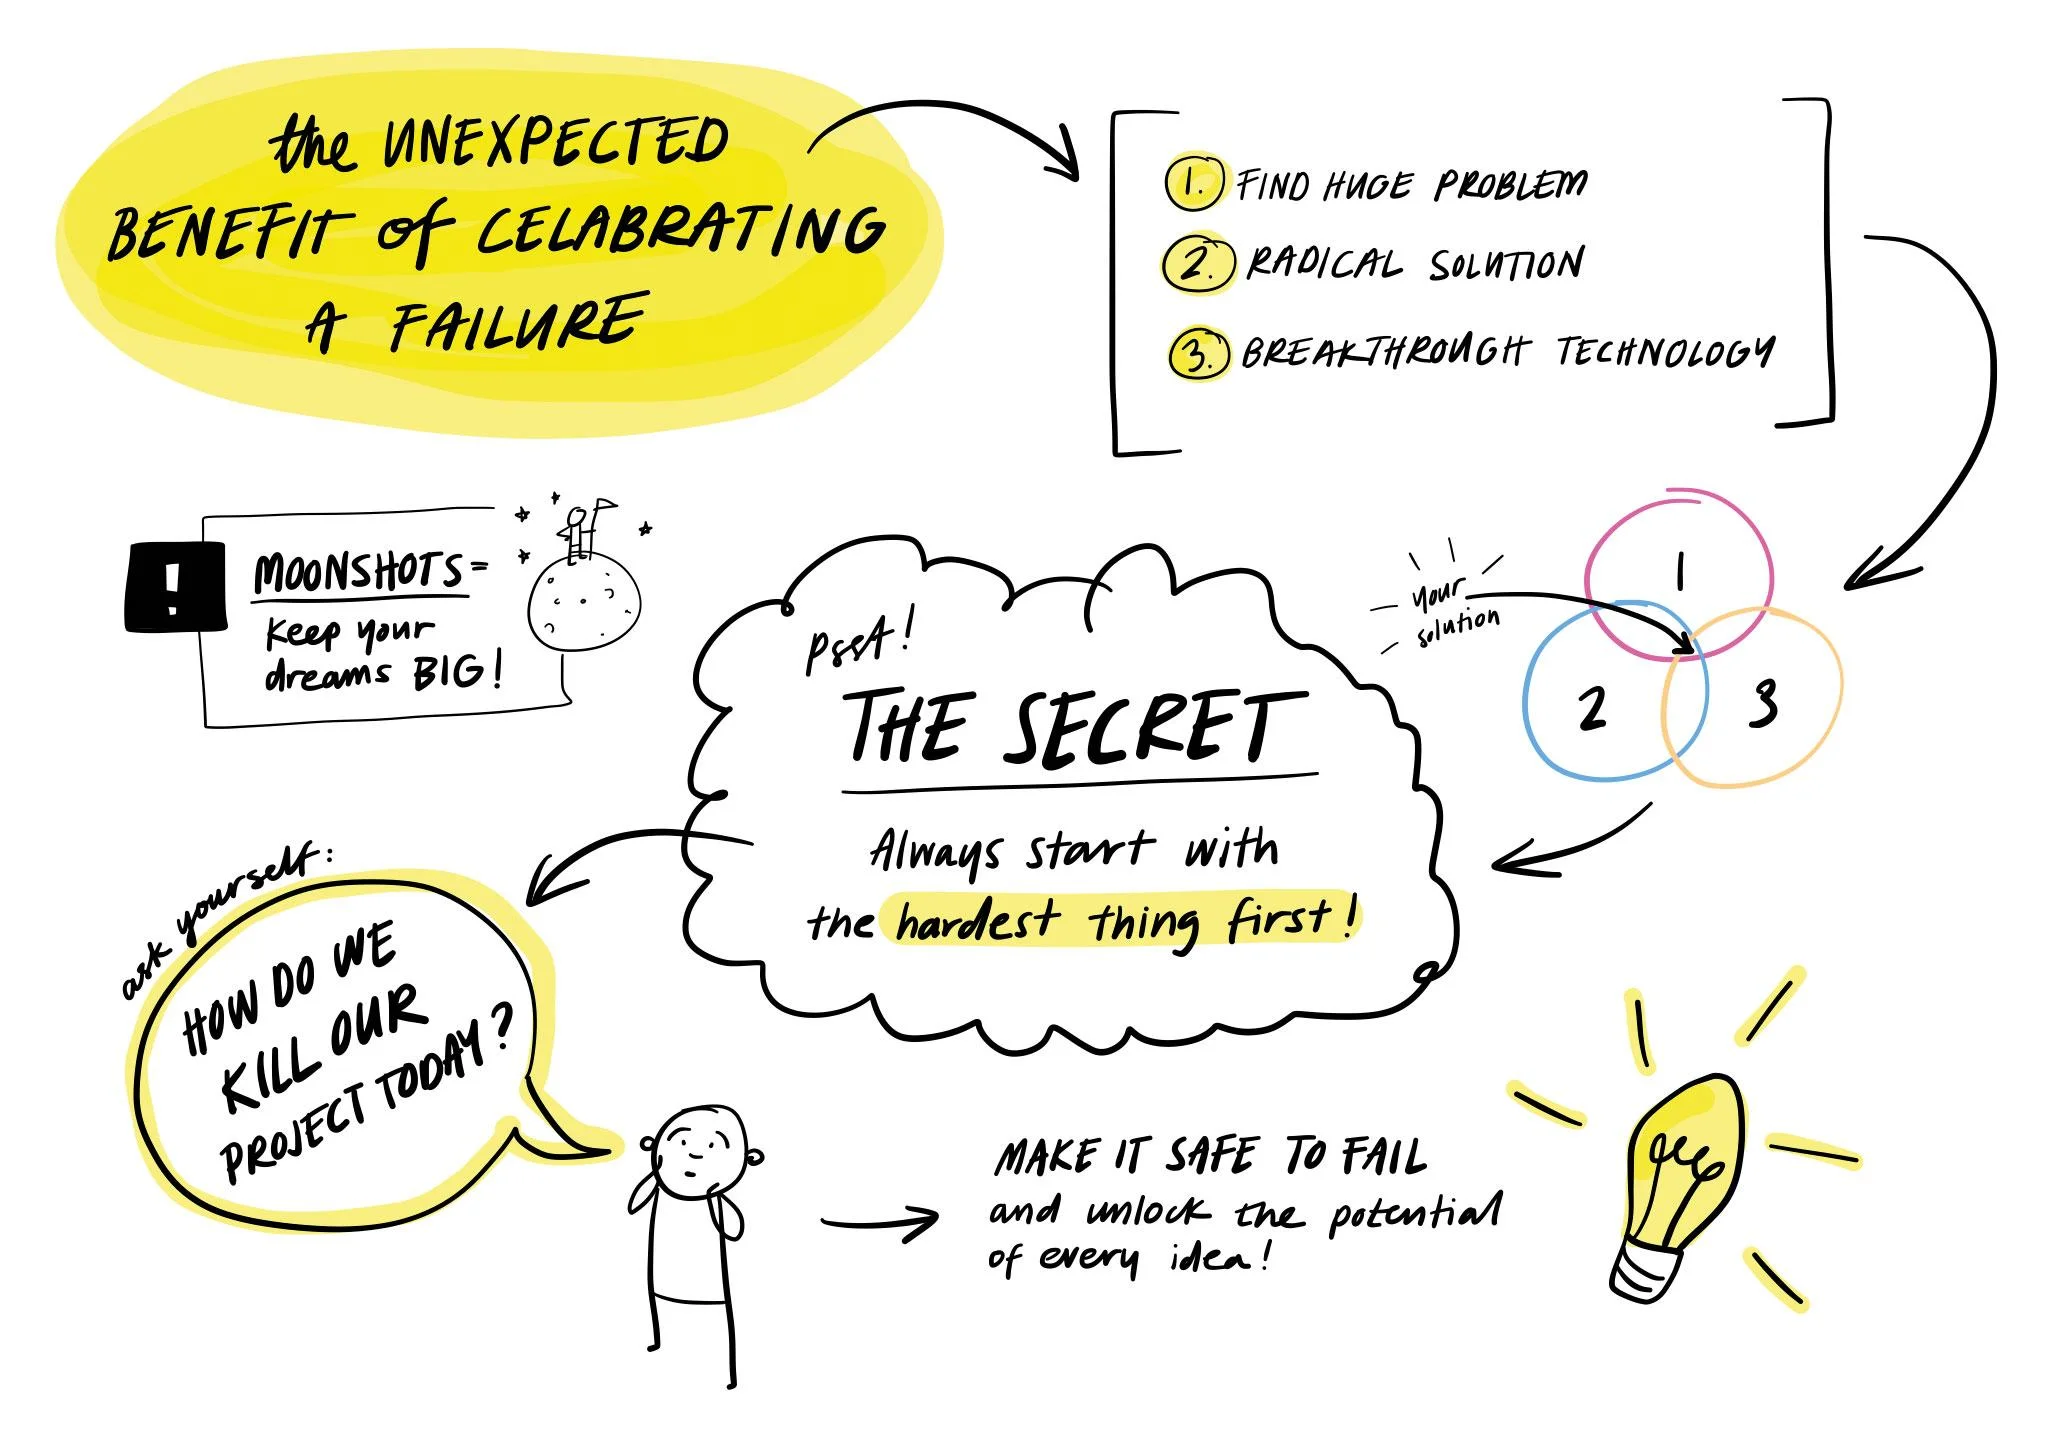
Sketchnotes. Doodles from a TED Talk from Skillshare student, Emy Eriksson. 

  Visual Resumes.  A clever chart submitted by Skillshare student  Emy Eriksson .

Visual Resumes. A clever chart submitted by Skillshare student Emy Eriksson.

 Sketchnotes. A TED Talk illustrated by Skillshare student,  Rob Dimeo . 

Sketchnotes. A TED Talk illustrated by Skillshare student, Rob Dimeo. 

  Drawing Data.  A commute story visualized by Skillshare student,  Dan H . 

Drawing Data. A commute story visualized by Skillshare student, Dan H. 

  Visual Resumes.  A spattering of SFDs submitted by Skillshare student  Christine Sheller.  

Visual Resumes. A spattering of SFDs submitted by Skillshare student Christine Sheller. 

  Visual Resumes.  A timeline of experience created by Skillshare student,  Nina Rycroft.  

Visual Resumes. A timeline of experience created by Skillshare student, Nina Rycroft. 

  Sketchnotes.  A Ted Talk visualized by Skillshare student,  Juliette Perkins . 

Sketchnotes. A Ted Talk visualized by Skillshare student, Juliette Perkins. 

1 2 3 4 5 6 7 8 9
Previous Next
  Drawing Data.  A commute from Skillshare student,  Sandra Martin . 
  Drawing Data.  Class project submitted by Skillshare student  Joshua Ganyon . 
  Sketchnotes.  Doodles from a TED Talk from Skillshare student,  Emy Eriksson . 
  Visual Resumes.  A clever chart submitted by Skillshare student  Emy Eriksson .
 Sketchnotes. A TED Talk illustrated by Skillshare student,  Rob Dimeo . 
  Drawing Data.  A commute story visualized by Skillshare student,  Dan H . 
  Visual Resumes.  A spattering of SFDs submitted by Skillshare student  Christine Sheller.  
  Visual Resumes.  A timeline of experience created by Skillshare student,  Nina Rycroft.  
  Sketchnotes.  A Ted Talk visualized by Skillshare student,  Juliette Perkins . 
  • Home/
  • Relay/
  • About/
  • Learn/

Catherine Madden

Catherine Madden LLC is a creative consultancy specializing in visual thinking and data storytelling. 

 
Search by Category
  • Book Report
  • Conferences
  • Life Lessons from Catmule
  • Projects
  • Services
  • Sketchbook Highlights
  • Speaking
  • Tutorial
  • Visualization
  • iPad Pro

Blog Archive

  • Life Lessons from Catmule
    • Sep 10, 2019 The Ultimate Meeting Supply List Sep 10, 2019
    • Apr 16, 2018 Falling Out of Love with Data (a second draft) Apr 16, 2018
    • Jun 12, 2017 9 Tips for Better Data Visualizations Jun 12, 2017
    • Mar 20, 2017 My *Expert* Opinion Mar 20, 2017
    • Jun 30, 2016 Skillshare Class #3: Creating a Standout Visual Resume Jun 30, 2016
    • Jun 3, 2016 Sketchtnote Army Podcast Jun 3, 2016
    • Jun 2, 2016 Get Over Yourselves, Designers Jun 2, 2016
    • Apr 21, 2016 TEDxCIA Recap Apr 21, 2016
    • Mar 14, 2016 Tapestry 2016 Recap Mar 14, 2016
    • Feb 10, 2016 My Second Skillshare Class: Behind the Scenes Feb 10, 2016
    • Nov 4, 2015 Blast from the Past: Building a Digital Brand Nov 4, 2015
    • Oct 21, 2015 Month 1 of Catherine Madden LLC Oct 21, 2015
    • Oct 15, 2015 On Scale Oct 15, 2015
  • Projects
    • Jan 5, 2021 Journey Mapping, Emotional Waves, and Fiber Art Data Viz Jan 5, 2021
    • Aug 21, 2017 Privilege, Perspective, and Power Aug 21, 2017
    • Jun 7, 2017 iPad Pro Inspiration Jun 7, 2017
    • Feb 28, 2017 Harry Potter Viz? Yes Plz. Feb 28, 2017
    • Jan 16, 2017 AFP Annual Conference Recap Jan 16, 2017
    • Nov 30, 2016 Visual Thinking and Storytelling Workshop with Betabooks Nov 30, 2016
    • Jun 30, 2016 Skillshare Class #3: Creating a Standout Visual Resume Jun 30, 2016
    • Feb 17, 2016 My First Infogr.am Feb 17, 2016
    • Feb 10, 2016 My Second Skillshare Class: Behind the Scenes Feb 10, 2016
    • Nov 17, 2015 What a difference a year can make! Nov 17, 2015
    • Nov 5, 2015 To the D-School, and Beyond! Nov 5, 2015
    • Oct 14, 2015 Digital Capture at the Age Lab Oct 14, 2015
  • Speaking
    • Apr 16, 2018 Falling Out of Love with Data (a second draft) Apr 16, 2018
    • Jan 16, 2017 AFP Annual Conference Recap Jan 16, 2017
    • Jun 3, 2016 Sketchtnote Army Podcast Jun 3, 2016
    • Apr 21, 2016 TEDxCIA Recap Apr 21, 2016
    • Mar 14, 2016 Tapestry 2016 Recap Mar 14, 2016
    • Dec 11, 2015 Data Viz DC Recap Dec 11, 2015
  • Sketchbook Highlights
    • May 30, 2017 Feeling Stuck? Try a Mind Map May 30, 2017
    • May 4, 2017 April Sketchbook Highlights May 4, 2017
    • Apr 6, 2017 March Sketchbook Highlights Apr 6, 2017
    • Feb 25, 2017 February Sketchbook Highlights Feb 25, 2017
    • Jan 31, 2017 January Sketchbook Highlights Jan 31, 2017
  • Tutorial
    • Nov 12, 2019 How to Shoot + Edit Meeting Photos, Part 2 Nov 12, 2019
    • Sep 12, 2019 How to Shoot + Edit Meeting Photos, Part 1 Sep 12, 2019
    • Sep 10, 2019 The Ultimate Meeting Supply List Sep 10, 2019
    • Dec 20, 2017 How to Draw & Display your iPad LIVE in a video chat Dec 20, 2017
  • Visualization
    • Apr 7, 2016 You Need to Bookmark DataUSA Apr 7, 2016
    • Mar 14, 2016 Tapestry 2016 Recap Mar 14, 2016
    • Feb 17, 2016 My First Infogr.am Feb 17, 2016
    • Jan 14, 2016 Playing With Real(ish) Data: Visualizing the Books I Read Last Year Jan 14, 2016
  • iPad Pro
    • Jun 7, 2017 iPad Pro Inspiration Jun 7, 2017
    • Feb 4, 2016 Highlights from the Visual Communication for Groups Pilot Feb 4, 2016
    • Nov 17, 2015 What a difference a year can make! Nov 17, 2015
    • Nov 11, 2015 Digital Scribing FAQ Nov 11, 2015
  • Book Report
    • Jan 5, 2017 Books of 2016 Jan 5, 2017
    • Jan 14, 2016 Playing With Real(ish) Data: Visualizing the Books I Read Last Year Jan 14, 2016
    • Oct 29, 2015 Book Report: Big Magic Oct 29, 2015
  • Services
    • Nov 30, 2016 Visual Thinking and Storytelling Workshop with Betabooks Nov 30, 2016
    • Apr 7, 2016 You Need to Bookmark DataUSA Apr 7, 2016
    • Nov 11, 2015 Digital Scribing FAQ Nov 11, 2015
  • Conferences
    • Mar 6, 2017 Tapestry 2017 Recap Mar 6, 2017